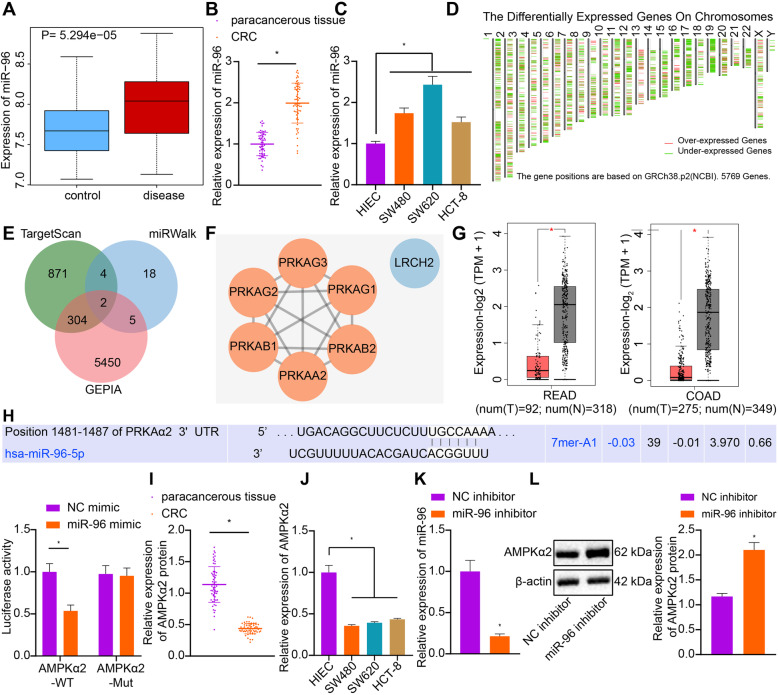
Fig. 1.
miR-96 targets and downregulates the expression of AMPKα2 in CRC. a: Boxplot of miR-96 expression in normal samples (left blue box) and CRC samples (right red box) obtained from microarray GSE38389 from the GEO database (https://www.ncbi.nlm.nih.gov/gds). b: The expression of miR-96 in clinical CRC tissues and non-tumor tissues determined by RT-qPCR (n = 60 for patients in each group). c: The expression of miR-96 in CRC cells and HIEC cells determined by RT-qPCR. d: Map of differentially expressed genes in TCGA database (https://portal.gdc.cancer.gov) analyzed by GEPIA (http://gepia2.cancer-pku.cn/#index). Red represents the significantly up-regulated genes, while green represents the significantly down-regulated genes. From left to right, chromosomes 1–22 and X and Y are in sequence. e: Venn diagrams of differentially expressed genes from GEPIA and downstream target genes of miR-96 from TargetScan (http://www.targetscan.org/vert_71/) and miRWalk (http://mirwalk.umm.uni-heidelberg.de); f: PPI network of genes related to LRCH2 and AMPKα2 constructed by String (https://string-db.org) and network image plotted by Cytoscape (https://cytoscape.org). The higher the core degree of the gene, the redder the circle, and conversely, the lower the core degree, the bluer the circle. g: The expression of AMPKα2 in CRC (left) and colon cancer (right) analyzed by GEPIA. The red box on the left represents that in cancer samples, while the gray box on the right represents that in normal samples. h: The binding of miR-96 to AMPKα2 predicted by TargetScan (http://www.targetscan.org/vert_71/) and confirmed by dual-luciferase reporter gene assay. i: The expression of AMPKα2 in clinical CRC tissues and non-tumor tissues determined by RT-qPCR (n = 60 for patients in each group). J: The mRNA expression of AMPKα2 in CRC cells and HIEC cells determined by RT-qPCR. K: The expression of miR-96 in CRC cells transfected with miR-96 inhibitor determined by RT-qPCR. L: The protein expression of AMPKα2 in CRC cells transfected with miR-96 inhibitor measured by Western blot analysis. Measurement data (mean ± standard deviation) between the two groups were analyzed by paired t test and those among multiple groups were compared by one-way ANOVA with Tukey’s post hoc tests. The cell experiment was independently repeated three times

