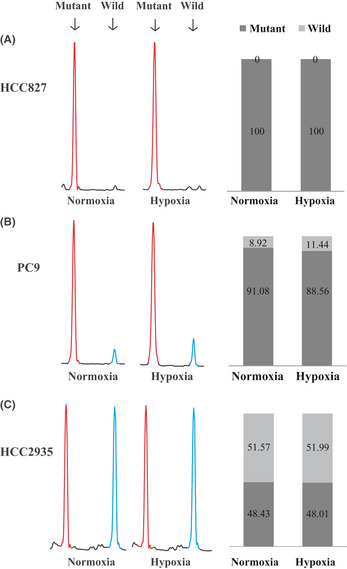
Figure 1.

Genetic status of epidermal growth factor receptor (EGFR) in HCC827 (A), PC9 (B), and HCC2935 (C) non‐small‐cell lung carcinoma cell lines. Left: Electropherograms of fragment analysis under normoxia and hypoxia. Red peak, amplified PCR fragment of exon 19 deletion mutation EGFR (73 or 70 bp); blue peak, wild‐type EGFR (88 bp). Right: Relative proportions of mutant and wild‐type EGFR expression determined by fragment analysis. Black bar, mutant EGFR; gray bar, wild‐type EGFR.
