
Figure 2.
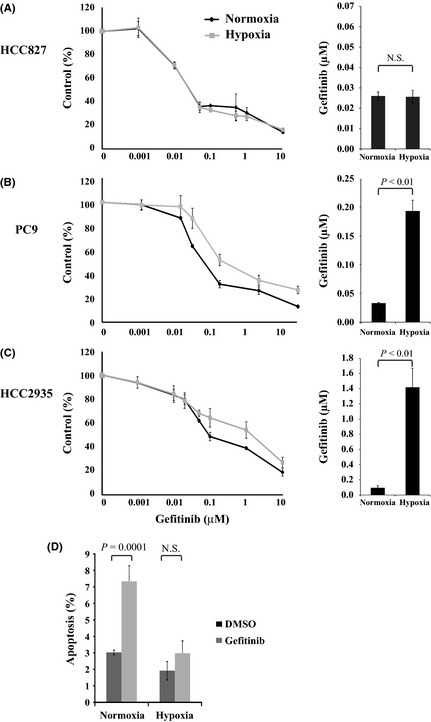
(A–C) Hypoxia induced gefitinib resistance in PC9 (B) and HCC2935 (C) but not in HCC827 (A) non‐small‐cell lung carcinoma cells. Left: Cells were incubated under hypoxia (1% O 2) or normoxia (21% O 2) for 48 h, followed by treatment with the indicated concentrations of gefitinib for 48 h. Each data point represents the average value of four samples and is expressed as a percentage of the surviving cells relative to the untreated controls. Right: Bar graphs showing the IC 50 values of cells resistant to gefitinib. (D) After hypoxia or normoxia for 48 h, PC9 cells were grown in the presence of 0.1% DMSO (control) or 0.1 μM gefitinib for 24 h. Apoptosis was assessed using propidium iodide and annexin‐V staining. The y‐axis denotes the sum of the early and late apoptotic cells as the mean ± standard error of the mean (n = 3). N.S., not significant.