
Figure 4.
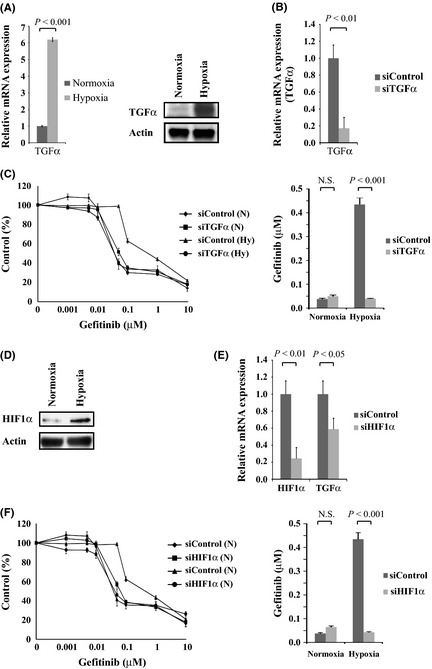
Transforming growth factor‐α (TGFα) and hypoxia‐inducible factor‐1α (HIF1α) were upregulated by hypoxia, and TGFα or HIF1α knockdown reversed hypoxia‐induced resistance to gefitinib in PC9 non‐small‐cell lung carcinoma cells. (A) TGFα messenger RNA and protein expression in PC9 cells under normoxia and hypoxia were analyzed by quantitative RT‐PCR (left) and Western blotting (right). (B) TGFα expression was knocked down in PC9 cells with siRNA. Two specific siRNAs and one non‐specific control were used, and data representative of the siRNA experiment are shown (P = 0.008). (C) Left: PC9 cells were transfected with siTGFα or siControl then incubated under hypoxia (Hy) or normoxia (N) for 48 h, followed by treatment with the indicated concentrations of gefitinib. Each data point is expressed as a percentage of the surviving cells relative to the untreated controls. Right: Bar graphs show the IC 50 values of the cells to gefitinib. The knockdown of TGFα expression significantly reduced the IC 50 value of the hypoxic PC9 cells. P < 0.001. (D) HIF1α expression in PC9 cells under normoxia and hypoxia was analyzed by Western blotting. (E) HIF1α expression was knocked down with siHIF1α in PC9 cells, resulting in the downregulation of TGFα expression (P = 0.004, P = 0.03, respectively). Two specific siRNAs and one non‐specific control were used; data representative of the siRNA experiment is shown. (F) Left: PC9 cells were transfected with siHIF1α or siControl then incubated under hypoxia (Hy) or normoxia (N) for 48 h followed by treatment with the indicated concentrations of gefitinib. Right: Bar graphs show the IC 50 values of cells to gefitinib. The knockdown of HIF1α expression significantly reduced the IC 50 value of the hypoxic PC9 cells. P < 0.001.