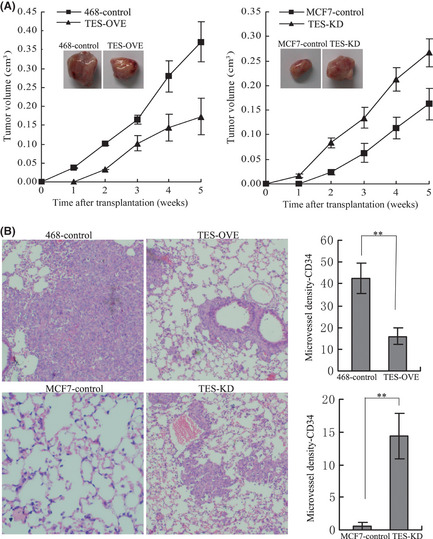
Figure 5.

Testin (TES) gene inhibited tumorigenic and metastatic capabilities in vivo. (A) Tumors isolated from mice 35 days after s.c. injection of control and TES transfected MDA‐MB‐468 and MCF‐7 cells in SCID mice. Growth curves of mammary tumors after injection of cells. Error bars represent mean ± SD (n = 7). (B) Lungs obtained from mice after injection into the lateral tail veins with control and TES overexpression MDA‐MB‐468 cells as well as TES knockdown MCF‐7 cells (H&E staining). Representative staining of lung sections showing the numbers of tumor nodules per field under light microscope. **P < 0.01.
