
Figure 4.
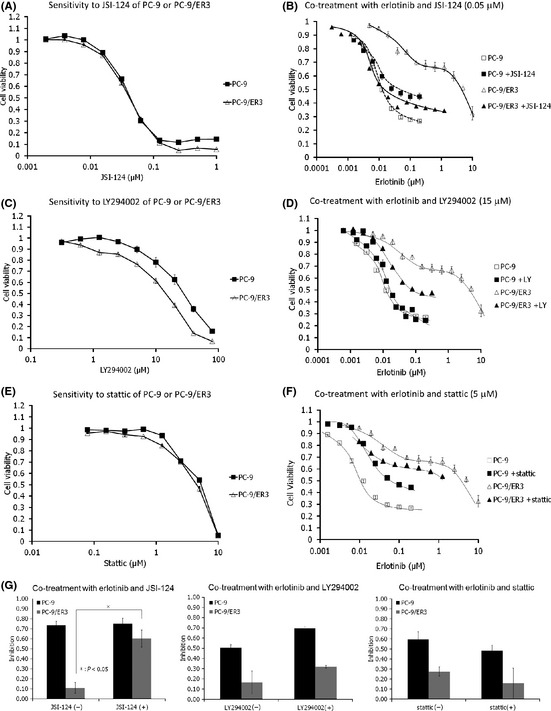
Comparison of cell growth after treatment with drugs alone or in combination. (A) Cells (3 × 10³ per well) were seeded in 96‐well plates in quadruplicate and grown in the absence or presence of the indicated concentration of JSI‐124. After 96 h, the cells were subjected to MTT assays. (B) Cells (3 × 10³ per well) were seeded in 96‐well plates in quadruplicate and grown in the absence or presence of the indicated concentration of erlotinib with or without 0.05 μM JSI‐124. After 96 h, the cells were subjected to MTT assays. (C, D) Same as in (A) and (B), respectively, but with LY294002. The concentration of LY290442 in (D) was 15 μM. (E, F) Same as in (A) and (B), respectively, but with Stattic. The concentration of Stattic in (f) was 5 μM. (G) Cells were treated with 10 nM erlotinib plus or minus 30 nM JSI‐124 (left panel), 5 μM LY294002 (center panel) or 2 μM Stattic (right panel) for 96 h. Growth inhibition relative to erlotinib‐untreated cells with or without JSI‐124, LY294002 or Stattic are shown. Data are representative of two independent experiments. Bars, standard error.