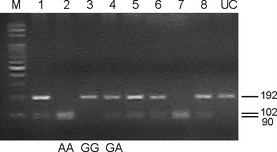
Figure 2.

Representative PCR‐RFLP patterns of different EGFR 521 genotypes. Genomic DNA obtained from patients' WBCs was subjected to PCR amplification. After being digested by Sty I, the PCR products were separated by agarose gel electrophoresis. Lanes 1, 4, 5, 6, and 8 represent G/A; lanes 2 and 7 represent A/A; lane 3 represents G/G. M, marker; UC, PCR product that has not been digested.
