
Figure 5.
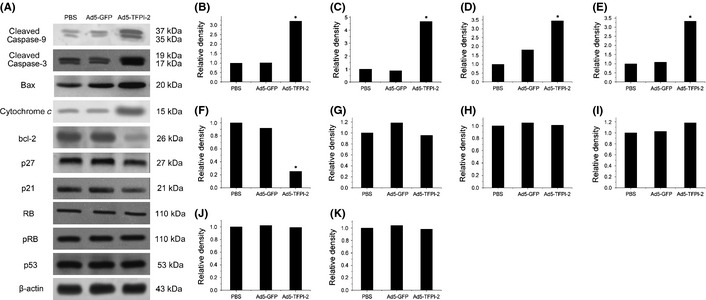
The expressions of apoptosis‐related and cell‐cycle‐related proteins in GBC‐SD cells were examined by western blotting. (A) The expressions of cytochrome c, Bax, cleaved caspase‐3, ‐9 were increased after treatment with adenovirus‐mediated gene transfer of tissue factor pathway inhibitor‐2 (Ad5‐TFPI‐2), whereas the expression of Bcl‐2 was decreased. In addition, the expression of total p53 protein was not significantly changed for all three groups after treatment with Ad5‐TFPI‐2. The expressions of RB/pRB, p21 and p27 were also examined, and no significant alteration was observed. The optical density of target bands and control bands was quantified using Image Pro Plus 6.0 software (Media Cybernetics, Silver Spring, MD, USA). The density ratios of target bands to control bands were used to analyze the difference among each band. The numerical values were shown as gray histograms. (B–K) Relative density of cleaved caspase‐9, cleaved caspase‐3, Bax, cytochrome c, Bcl‐2, p27, p21, RB, pRB, p53. Asterisk (*) indicates significant difference.