Abstract
We previously showed tumor‐associated macrophages/microglia (TAMs) polarized to the M2 phenotype were significantly involved in tumor cell proliferation and poor clinical prognosis in patients with high grade gliomas. However, the detailed molecular mechanisms involved in the interaction between TAMs and tumor cells have been unclear. Current results reveal that, in coculture with human macrophages, BrdU incorporation was significantly elevated in glioma cells, and signal transducer and activator of transcription‐3 (Stat3) activation was found in both cell types. Direct mixed coculture led to stronger Stat3 activation in tumor cells than did indirect separate coculture in Transwell chamber dishes. Screening with an array kit for phospho‐receptor tyrosine kinases revealed that phosphorylation of macrophage‐colony stimulating factor receptor (M‐CSFR, CD115, or c‐fms) is possibly involved in this cell–cell interaction; M‐CSFR activation was detected in both cell types. Coculture‐induced tumor cell activation was suppressed by siRNA‐mediated downregulation of the M‐CSFR in macrophages and by an inhibitor of M‐CSFR (GW2580). Immunohistochemical analysis of phosphorylated (p)M‐CSFR, pStat3, M‐CSF, M2 ratio, and MIB‐1(%) in high grade gliomas revealed that higher staining of pM‐CSFR in tumor cells was significantly associated with higher M‐CSF expression and higher MIB‐1(%). Higher staining of pStat3 was associated with higher MIB‐1(%). High M2 ratios were closely correlated with high MIB‐1(%) and poor clinical prognosis. Targeting these molecules or deactivating M2 macrophages might be useful therapeutic strategies for high grade glioma patients.
Macrophages that infiltrate cancer tissues are called tumor‐associated macrophages (TAMs) and are closely involved in development of the tumor microenvironment by inducing angiogenesis, immunosuppression, and invasion.1, 2 Tumor‐associated macrophages are generally thought to belong to the alternatively activated macrophage population (M2) because of their anti‐inflammatory functions.3 In many kinds of malignant tumors, including melanoma, malignant lymphoma, leiomyosarcoma, pancreatic tumors, intrahepatic cholangiocarcinoma, renal cell carcinoma, and high grade glioma, the presence of M2‐polarized TAMs is associated with poor clinical prognosis.4, 5, 6, 7, 8, 9, 10, 11 Although it is well known that many TAMs infiltrate into high grade gliomas and are associated with angiogenesis and immunosuppression,12, 13, 14, 15 results of this study show that M2‐polarized TAMs are significantly involved in glioma tumor cell proliferation and are related to poor prognosis of high grade glioma patients.6
Signal transducer and activator of transcription‐3 (Stat3) affects the tumor microenvironment and tumor development by virtue of its association with immunosuppression, angiogenesis, and cancer cell proliferation.16, 17 In some kinds of malignant tumors, including high grade glioma, patients with high Stat3 activation in tumor cells have significantly worse clinical prognosis.18 Therefore, Stat3 is thought to be an important target molecule for anticancer therapy, and many researchers have introduced various kinds of Stat3 inhibitors as anticancer drugs.19 Stat3 signaling in macrophages is known to participate in regulating immune responses. Targeted disruption of Stat3 signaling resulted in activation of antigen‐specific T cells, and suppressed tumor development in murine cancer models.20, 21, 22 In patients with glioblastoma, inhibition of Stat3 not only suppressed tumor cell growth but also reversed immune tolerance by impairing the immune‐suppressive function of alternatively activated macrophage/microglia.23
In this study, M2 macrophages were found to support proliferation of glioma cells through Stat3 activation. Cell–cell interaction during direct contact between tumor cells and macrophages contributes to strong activation of macrophages, which in turn activates tumor cells. In vitro results of the use of a receptor‐type tyrosine kinase (RTK) array revealed the importance of macrophage‐colony stimulating factor receptor (M‐CSFR) activation in this cell–cell interaction. The crucial role of macrophage‐colony stimulating factor (M‐CSF), especially membrane‐type M‐CSF (mM‐CSF), and its binding to M‐CSFR during direct cell–cell interactions between tumor cells and macrophages was determined.
Materials and Methods
Macrophage culture
Peripheral blood mononuclear cells were obtained from three healthy volunteer donors and written informed consent for experimental use of the same was supplied by all donors. CD14+ monocytes were isolated using CD14 microbeads (Miltenyi Biotec, Bergisch Gladbach, Germany). Monocytes were plated in 6‐well (1 × 10⁵/well) or 12‐well (5 × 10⁴/well) plates and cultured with granulocyte M‐CSF (2 ng/mL) (Wako, Tokyo, Japan) for 5 days to induce immature macrophages. After PBS washes, cells were stimulated with γ‐interferon (1 ng/mL) (PeproTech, Rocky Hill, NJ, USA) to induce M1 macrophages. These cells were stimulated with 50% tumor‐cell supernatant (TCS) to induce M2 macrophages, because TCS contains many anti‐inflammatory cytokines and pushes macrophage polarization toward the M2 phenotype.6
Cell lines
Tumor‐cell supernatant was prepared as described previously.6 The human glioblastoma cell line T98G was purchased from ATCC (Manassas, VA, USA) and was maintained in DMEM supplemented with 10% FBS, 100 U/mL penicillin, 100 μg/mL streptomycin, and 0.1 mg/mL sodium pyruvate. The mycoplasma test was carried out using a PCR detection kit (Takara Bio, Otsu, Japan). Human myeloid leukemia TF‐1 cells expressing M‐CSFR were cultured in DMEM with 10% FBS and granulocyte M‐CSF, as described previously.24
Coculture experiment
To investigate the cell–cell interaction between tumor cells and macrophages, coculture experiments were carried out as described previously.25 Briefly, after macrophages were washed in PBS, they were co‐incubated with T98G cells for 2 days to evaluate the significance of direct cell–cell contact. To examine the influence of indirect cell–cell interaction, Transwell chamber dishes (Nunc, Rochester, NY, USA) were used.
BrdU incorporation and immunostaining
BrdU incorporation and immunostaining was carried out using the BrdU ELISA kit (Roche, Basel, Switzerland) according to the manufacturer's protocol with minor modifications. Briefly, after culture with BrdU for 90 min, cells were fixed by acetone. CD204 (clone SRA‐E5; Transgenic, Kumamoto, Japan) was stained and visualized using the Warp Red chromogen kit (Biocare Medical, Concord, CA, USA). After washes in glycine buffer (pH 2.2), cells were stained with anti‐BrdU antibody and visualized using the diaminobenzidine substrate system (Nichirei, Tokyo, Japan).
Immunofluorescence staining of pStat3
Paraffin‐embedded cell block specimens were prepared and sectioned as described previously.25 Mounted sections were deparaffinized in xylene and rehydrated in a graded ethanol series. Following treatment for antigen retrieval, sections were reacted with anti‐CD204 antibody (mouse monoclonal, clone SRA‐E5) and anti‐pStat3 antibody (Tyr705, clone D3A7; Cell Signaling Technology, Denver, MA, USA). Antibodies were diluted with CanGetSignal (Toyobo, Tokyo, Japan). Alexa Fluor 488 goat anti‐mouse IgG and Alexa Fluor 546 goat anti‐rabbit IgG (Invitrogen, Camarillo, CA, USA) were used as secondary antibodies.
Inhibitor
The M‐CSFR inhibitor GW2580 (Calbiochem, Nottingham, UK) was used at either 20 nM or 30 nM concentrations.
Small interfering RNA in human macrophages
Human macrophages were transfected with siRNA against human Stat3 (Santa Cruz Biotechnology, Santa Cruz, CA, USA) or M‐CSFR (Santa Cruz Biotechnology) using Lipofectamine RNAi MAX (Invitrogen). Control siRNA (Santa Cruz Biotechnology) was used as a negative control. Downregulation of Stat3 and M‐CSFR was evaluated by Western blot and real‐time PCR, respectively, as described previously文献追加.9
Evaluation of cytokine secretion in supernatant
The interleukin (IL)‐10 concentration in supernatants was determined using ELISA kits (PeproTech).
Phospho‐receptor tyrosine kinase array analysis
The relevant phospho‐receptor tyrosine kinase (RTK) array was purchased from R&D Systems (Minneapolis, MN, USA), and used according to the manufacturer's protocol.
Flow cytometry
Cells were detached from wells using enzyme‐free Cell Dissociation Buffer (Gibco, Grand Island, NY, USA) and immediately fixed with 4% paraformaldehyde. After incubation with 0.1% saponin, cells were reacted with anti‐pM‐CSFR antibody and anti‐CD68 antibody (mouse monoclonal, clone PM‐1K26). Then FITC‐labeled anti‐mouse IgG and phycoerythrin‐labeled anti‐rabbit IgG were used as secondary antibodies, and cells were analyzed by FACSCalibur.
Human glioblastoma samples
From January 2006 to September 2009, paraffin‐embedded tissue samples from 62 patients with high grade gliomas (nine patients with anaplastic astrocytoma and 53 patients with glioblastoma) were prepared for this study. Cases with massive necrosis were not enrolled. Informed written consent was obtained from all patients in accordance with protocols approved by the Kumamoto University Review Board. Tissue samples were fixed in 10% neutral buffered formalin and were embedded in paraffin.6
Immunostaining and double immunostaining of surgical specimens
Sections were deparaffinized in xylene and rehydrated in a graded ethanol series. Anti‐pStat3 antibody (clone D3A7; Cell Signaling Technology), anti‐pM‐CSFR antibody (Tyr 723, clone 49C10; Cell Signaling Technology), anti‐M‐CSF antibody (clone EP1179Y; Novus Biologicals, Littleton, CO, USA), anti‐CD163 antibody (clone 10D6; Novocastra, Newcastle, UK), anti‐Iba‐1 (polyclonal; Wako), and anti‐Ki‐67 (clone MIB‐1; Dako, Glostrup, Denmark) were used as primary antibodies. Horseradish peroxidase‐labeled or alkaline phosphatase‐labeled antibodies (Nichirei) were used as secondary antibodies. Reactions were visualized by the diaminobenzidine system (Nichirei), Fast Blue solution (Sigma, St. Louis, MO, USA), or HistoGreen (Linaris Biologische, Wertheim‐Bettingen, Germany). Macrophage‐colony stimulating factor receptor activation and M‐CSF expression was scored as 0 (negative), 1 (weak), or 2 (strong) by two pathologists (Y.K. and H.H.) who were blind to the sample data, then the sum of scores for each sample was categorized as “low” (score 0–2) or “high” (score 3–4). The MIB‐1 index and M2 ratio (CD163+ cells/Iba‐1+ cells) were determined by two pathologists (Y.K. and H.H.) and the values obtained were averaged. Because a previous study showed that the ratio of CD163+ TAMs is closely correlated with tumor cell proliferation and clinical prognosis,6 patients were divided into two M2 ratio groups, low (<30%) and high (≥30%). Stat3 activation was scored as 0 to 8 as described previously,27 then the sum of scores for each sample was categorized as “low” (score 0–4) or “high” (score 5–8).
Statistics
Statistical analysis of in vitro and in vivo data was carried out using JMP10 (SAS Institute, Chicago, IL, USA). All data from in vitro studies represent results of two or three independent experiments. Data are expressed as the mean ± SD. The Mann–Whitney U‐test was used for two‐group comparisons. A value of P < 0.05 was considered statistically significant.
Results
Glioblastoma cells were activated by coculture with M2 macrophages
In the first experiments, the effects of cell–cell interaction between macrophages and T98G cells were investigated by means of the coculture system. BrdU incorporation into T98G cells was evaluated by double immunostaining, and was found to be significantly upregulated by coculture with macrophages; M2, rather than M1, cells caused a notable increase of BrdU incorporation by T98G cells (Fig. 1a,b). The proliferation of T98G cells was increased by coculture with M1 and M2, but notably higher proliferation was induced by M2 (Fig. 1c).
Figure 1.
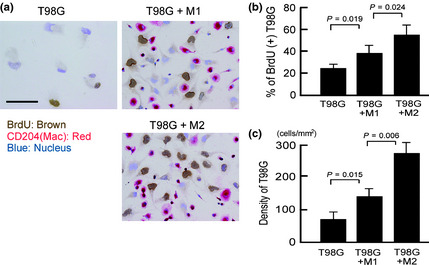
Tumor cell proliferation by coculture with macrophages. (a) Primary monocyte‐derived macrophages were stimulated with γ‐interferon (M1) or tumor‐cell supernatant (M2), and cocultured with T98G cells for 2 days. Double immunostaining of CD204 and BrdU was carried out to evaluate BrdU incorporation by tumor cells. CD204+ cells (red) indicate macrophages. (b) BrdU + cells among CD204− tumor cells were counted under a microscope. (c) The number of tumor cells per 1 mm2 was counted under a microscope.
As Stat3 is one of the signaling molecules related to cell proliferation and survival, Stat3 activation was evaluated in the coculture system. When M2 cells and T98G cells were cocultured, both cell types showed strong nuclear staining of pStat3 (Fig. 2a,b). In contrast to indirect coculture conditions, direct cell–cell interaction caused significantly stronger Stat3 activation in cancer cells (Fig. 2b). Stat3 activation in T98G cells was more strongly induced by coculture with M2 cells compared with M1 cells (Fig. 2b). The proliferation of T98G cells was induced by stimulation with conditional medium of cocultured M2 cells and T98G cells, and this effect was significantly suppressed by blocking Stat3 in T98G cells (Fig. 2c).
Figure 2.
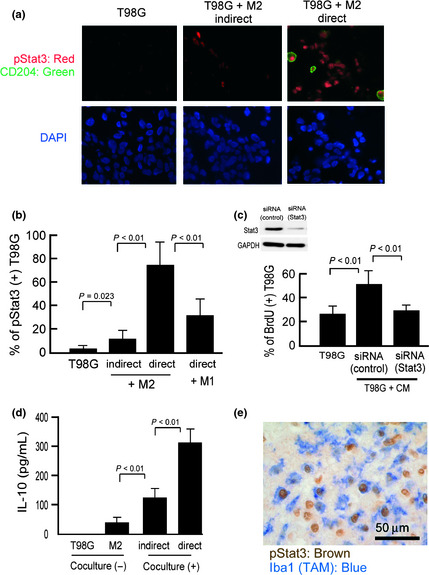
Signal transducer and activator of transcription‐3 (Stat3) activation in cocultured cells. (a) T98G cells were cocultured with tumor‐cell supernatant‐stimulated M2 macrophages, and Stat3 activation was analyzed by double immunostaining of pStat3 (red) and CD204 (green). Blue indicates nuclear staining. Scale bar = 50 μm. (b) Following double immunostaining, 100 CD204− T98G cells were counted, and the percentage of pStat3+ cells was calculated (n = 3 or 4 for each group). (c) BrdU incorporation in conditional medium‐stimulated T98G cells was evaluated with or without Stat3 siRNA. (n = 3 for each group). Downregulation of Stat3 protein in T98G cells was also confirmed by Western blot analysis. (d) Interleukin (IL)‐10 production was evaluated as a marker of macrophage activation (n = 4 for each group). (e) Double immunostaining of activated Stat3 (brown) and Iba‐1 (marker of macrophages/microglia; blue) was carried out.
To evaluate macrophage activation in the coculture system, IL‐10 concentrations in supernatants were determined, because no IL‐10 secretion was detected in supernatants of T98G cell monocultures. As shown in Figure 2(d), IL‐10 secretion was induced by coculture and, notably, direct coculture induced significantly increased IL‐10 secretion. We next evaluated Stat3 activation in human glioma tissues. Among 12 high grade glioma samples analyzed, 10 showed distinct infiltration of pStat3+ TAMs (Fig. 2e). These observations indicate a critical role for Stat3 in cell–cell interaction between tumor cells and macrophages.
Activation of Stat3 involved in cell–cell interaction between glioma cells and macrophages
We next suppressed Stat3 in M2 macrophages using siRNA before coculture with T98G cells to ascertain whether Stat3 activation in macrophages contributes to the cell–cell interaction (Fig. 3a,b). Incorporation of BrdU into T98G cells was significantly inhibited by Stat3 suppression in macrophages (Fig. 3b). Secretion of IL‐10 from macrophages was also inhibited by Stat3 suppression (Fig. 3c). As Figure 3(d) shows, Stat3 activation in T98G cells was decreased by blocking Stat3 in macrophages. These data indicate that macrophage activation through Stat3 signaling is important for tumor cell activation in coculture.
Figure 3.
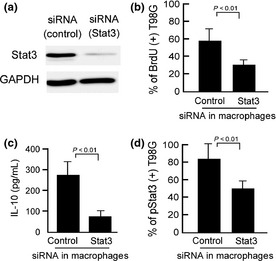
Effect of selective signal transducer and activator of transcription‐3 (Stat3) silencing in macrophages on Stat3 activation in glioma cells. (a) Western blot analysis confirmed suppression of Stat3 in macrophages. (b) Two days after suppression of Stat3 in macrophages, T98G cells were added to the culture. After coculture for 2 days, double immunostaining of CD204 and BrdU was carried out. Percentages of BrdU + cells among CD204− tumor cells were calculated. (c) In the same conditions, interleukin (IL)‐10 concentration in supernatants was determined. (d) After the same treatment, cells were prepared as cell block specimens and double immunostaining of CD204 and pStat3 was done. Percentages of pStat3+ cells among the CD204− tumor cells were calculated.
Activation of M‐CSFR involved in cell–cell interaction
Direct contact with tumor cells significantly induced macrophage activation. Therefore, we hypothesized that RTK mediates this effect, and RTK array analysis was carried out. Activation of RTK in cocultured cells was compared with that of macrophages and T98G cells cultured separately, and significant activation of M‐CSFR was found in cocultured macrophages (Fig. 4a), as well as, interestingly, in the cocultured T98G cells (Fig. 4b).
Figure 4.
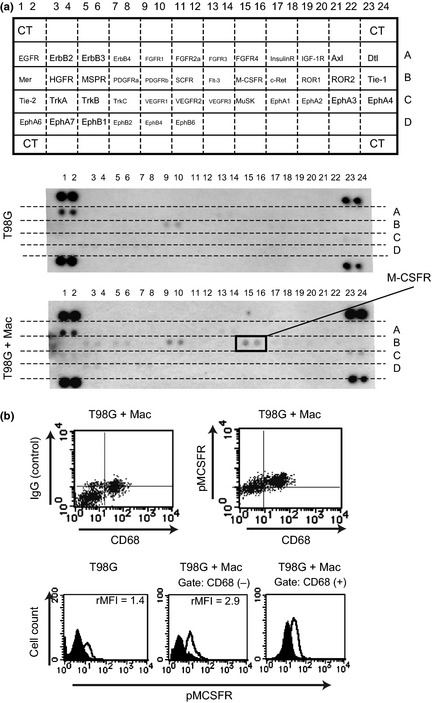
Receptor‐type tyrosine kinase array and flow cytometry. (a) Receptor‐type tyrosine kinase array analyses were carried out and results for cocultured cells (T98G + Mac) and T98G cells in monoculture (T98G) were compared. CT, positive control. (b) Phosphorylation of macrophage colony‐stimulating factor receptor (M‐CSFR) was evaluated by flow cytometry. Representative data from one of two experiments.
Activation of M‐CSFR involved in macrophage activation by direct cell–cell interaction, and induced Stat3 activation in tumor cells
Next, we investigated whether M‐CSFR is involved in macrophage activation by coculture with T98G cells. The T98G cells expressed mM‐CSF on their cell surface membranes (Fig. 5a). Neutralizing antibody for mM‐CSF and silencing of M‐CSFR significantly inhibited IL‐10 secretion in direct coculture (Fig. 5b–d). An inhibitor of M‐CSFR (GW2580) also suppressed IL‐10 secretion (Fig. 5e). Activation of Stat3 was inhibited by silencing M‐CSFR in macrophages (Fig. 5f) and was significantly induced by M‐CSF stimulation in macrophages (Fig. 5g). These data indicate that M‐CSFR signaling contributes to Stat3 activation in cocultured macrophages.
Figure 5.
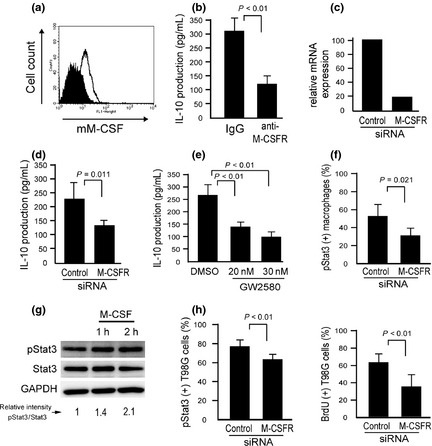
Involvement of macrophage colony‐stimulating factor receptor (M‐CSFR) in direct cell–cell interaction. (a) Membrane‐type M‐CSF (mM‐CSF) was expressed on the surface membranes of T98G cells. (b) T98G cells were cocultured with macrophages in the presence of anti‐M‐CSF antibody for 2 days, and interleukin (IL)‐10 in the supernatant was measured by ELISA. Non‐immunized rabbit IgG was used as the control. (c) Downregulation of M‐CSFR by siRNA was confirmed by real‐time PCR. (d) T98G cells were cocultured with macrophages having silenced M‐CSFR for 2 days, and IL‐10 in the supernatant was measured. (e) Macrophages and T98G cells were mixed and cultured with the M‐CSFR inhibitor GW2580 for 2 days, and IL‐10 in the supernatant was measured. (f) M‐CSFR of macrophages was silenced by siRNA, and coculture proceeded for 2 days. Signal transducer and activator of transcription‐3 (Stat3) activation in macrophages was evaluated by double immunostaining. (g) Macrophages were stimulated with M‐CSF (100 ng/mL) for 1 or 2 h, and Stat3 activation was evaluated. (h) M‐CSFR of macrophages was silenced by siRNA, and coculture proceeded. BrdU incorporation and Stat3 activation in T98G cells was examined by double immunostaining (n = 3 or 4 for each group).
We then tested if M‐CSFR signaling in macrophages influences tumor cell activation. Both BrdU incorporation and Stat3 activation in cocultured tumor cells were decreased by silencing M‐CSFR in macrophages (Fig. 5h).
M2 ratio and M‐CSFR activation associated with MIB‐1 index in high grade glioma
Immunostaining for pM‐CSFR, M‐CSF, CD163, Iba‐1, and MIB‐1 was carried out in 62 cases of high grade glioma. Mutual correlations of their expression and the association with clinical prognosis were statistically evaluated (Tables 1, 2). The specificity of anti‐pM‐CSFR antibody was confirmed using M‐CSFR‐expressing TF‐1 histiocytic cells (Fig. 6a). Both M‐CSF expression and M‐CSFR activation, as well as M2 phenotype, were classified into two groups, high and low, as described above (Fig. 6b). A positive pM‐CSFR signal was seen in both tumor cells and macrophages (Fig. 6c). Activation of Stat3 was also classified into two groups (Fig. 6d). Higher activation of M‐CSFR in tumor cells was closely associated with higher M‐CSF expression and a higher MIB‐1 (%) (Table 1, Fig. 6d). A higher M2 ratio (CD163+ cells/Iba‐1+ cells), higher M‐CSF expression, and higher Stat3 activation was also correlated with a higher MIB‐1(%) (Fig. 6e). In addition, the patients with higher ages, M2 ratios, or MIB‐1(%) had statistically significant shorter survival periods (Fig. 6f, Table 2). The patients with higher M‐CSFR and Stat3 activation had shorter survival periods, but this result was not statistically significant (Fig. 6g,h). In addition, M‐CSF expression was not significantly associated to clinical prognosis (Fig. 6i).
Table 1.
Clinicopathologic factors, macrophage‐colony stimulating factor receptor (M‐CSFR) activation, macrophage‐colony stimulating factor (M‐CSF) expression, and signal transducer and activator of transcription‐3 (Stat3) activation in high grade glioma
| Variable | n | M‐CSFR activation | P‐value | M‐CSF expression | P‐value | Stat3 activation | P‐value | |||
|---|---|---|---|---|---|---|---|---|---|---|
| Low | High | Low | High | Low | High | |||||
| Age, years | ||||||||||
| <60 | 26 | 15 | 11 | P = 0.700 | 12 | 14 | P = 0.760 | 11 | 15 | P = 0.025 |
| ≥60 | 36 | 19 | 17 | 18 | 18 | 6 | 30 | |||
| Gender | ||||||||||
| Male | 40 | 18 | 22 | P = 0.036 | 18 | 22 | P = 0.470 | 8 | 32 | P = 0.077 |
| Female | 22 | 16 | 6 | 12 | 10 | 9 | 13 | |||
| M‐CSFR activation | ||||||||||
| Low | 33 | – | – | – | 25 | 8 | P < 0.001 | 11 | 22 | P = 0.270 |
| High | 29 | – | – | 3 | 26 | 6 | 23 | |||
| M‐CSF expression | ||||||||||
| Low | 30 | – | – | – | – | – | – | 10 | 20 | P = 0.310 |
| High | 32 | – | – | – | – | 7 | 25 | |||
| M2 macrophages | ||||||||||
| Low | 25 | 15 | 10 | P = 0.27 | 17 | 8 | P = 0.011 | 9 | 16 | P = 0.210 |
| High | 37 | 17 | 20 | 13 | 24 | 8 | 29 | |||
Bold text indicates statistically significant results, calculated using the chi‐squared test.
Table 2.
Univariate Cox regression analysis of potential prognostic factors
| Univariate analysis | ||||
|---|---|---|---|---|
| n | Mean survial (weeks) | P‐value Log–rank | P‐value Wilcoxon | |
| Age, years | ||||
| <60 | 26 | 88 | 0.034 | 0.006 |
| ≥60 | 36 | 57 | ||
| Gender | ||||
| Male | 40 | 72 | 0.42 | 0.91 |
| Female | 22 | 65 | ||
| pM‐CSFR | ||||
| Low | 34 | 78 | 0.054 | 0.089 |
| High | 28 | 64 | ||
| M‐CSF | ||||
| Low | 33 | 72 | 0.49 | 0.57 |
| High | 29 | 65 | ||
| Stat3 activation | ||||
| Low | 17 | 124 | 0.058 | 0.22 |
| High | 45 | 85 | ||
| M2 ratio | ||||
| Low | 25 | 98 | 0.003 | 0.004 |
| High | 37 | 62 | ||
| MIB‐1 (%) | ||||
| <30 | 26 | 113 | 0.0005 | 0.0007 |
| ≥30 | 36 | 56 | ||
Bold text indicates statistically significant results. M‐CSF, macrophage‐colony stimulating factor; pM‐CSFR, phosphorylated M‐CSF receptor; MIB‐1, anti‐Ki‐67; Stat3, transducer and activator of transcription‐3.
Figure 6.
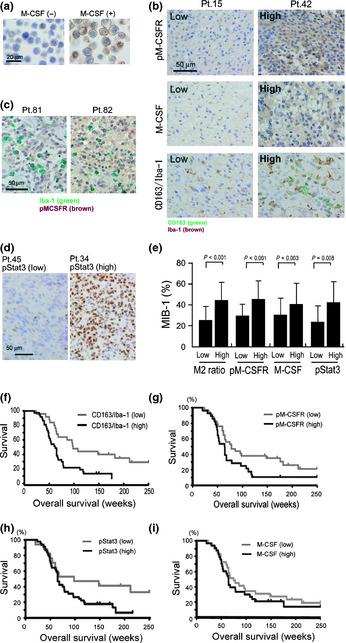
Immunohistochemical determination of phosphorylated macrophage‐colony stimulating factor receptor (pM‐CSFR), macrophage‐colony stimulating factor (M‐CSF), phosphorylated signal transducer and activator of transcription‐3 (pStat3), anti‐Ki‐67 (clone MIB‐1), and M2 ratios in human high grade gliomas. (a) TF‐1 culture cells were stimulated by M‐CSF for 5 min and activation of M‐CSFR was evaluated by immunostaining with anti‐pM‐CSFR. Strong activation of pM‐CSFR was detected on cell surfaces of M‐CSF‐stimulated TF‐1 cells. (b) Immunostaining of pM‐CSFR, M‐CSF, and double immunostaining of CD163 (green) and Iba‐1 (brown) were carried out. Results for patient (Pt.) no. 15 and no. 42 are shown. (c) By double immunostaining ofIba‐1 (green) and pM‐CSFR (brown), pM‐CSFR was detected in both tumor cells and macrophages. (d) Immunostaining of pStat3 was also carried out to evaluate the Stat3 activation in tumor cells. (e) M2 ratio, M‐CSFR activation, Stat3 activation, and M‐CSF expression were correlated with the MIB‐1 index. The Kaplan–Meier method was used to determine (f) M2 ratio, (g) M‐CSFR activation, (h) Stat3 activation and (i) M‐CSF expression.
Discussion
The importance of TAMs in tumor growth has been well documented, and TAMs are thought to contribute to tumor progression and invasion.28, 29 In this study, we showed that direct contact with glioma cells induces macrophage activation, which in turn activates tumor cells. Macrophage activation through M‐CSFR/Stat3 signaling was shown to play an important role in cell–cell interaction. Analysis of human glioma samples indicated that M‐CSFR activation and M2 ratios are associated with tumor cell proliferation.
The importance of direct cell–cell contact in cell–cell interaction has been a focus for several researchers. Direct cell–cell contact between macrophages and tumor cells protected tumor cells from chemotherapy drug‐induced apoptosis, whereas cell–cell interaction without direct contact did not.30 A previous study showed that Stat3 activation in ovarian and kidney cancer cells was significantly induced by direct coculture with macrophages.9, 25 As Stat3 is associated with cancer cell proliferation and survival,16, 17 macrophages are thought to support cancer cell proliferation and survival in patients with malignant tumors. A selective Stat3 inhibitor and Stat3 siRNA reversed cytokine expression levels and suppressed tumor growth in vivo, and this indicated a major contribution of Stat3 signaling in the immunosuppression by glioma‐derived factors.31, 32
It is well known that mM‐CSF induces stronger activation of M‐CSFR than soluble M‐CSF, although details of the mechanisms involved have been unclear.33, 34 In this study, the possible involvement of mM‐CSF–M‐CSFR binding on strong Stat3 activation in tumor microenvironment was shown. It is well known that M‐CSFR signaling activates some signal molecules including Stat3 activation,35 and the results shown in Figure 5 indicate that M‐CSFR signaling was significantly related to Stat3 activation in this coculture system. Stat3 activation plays an important role in maintenance of glioma stem cells (GSCs),36 and unknown Stat3‐related cytokines derived from GSCs induce macrophage polarization into the M2 phenotype.37 Although M‐CSF expression in GSCs has, to the best of our knowledge, never been reported, the current results suggest that cell–cell interaction between macrophages and GSCs is involved in creating the stem‐cell niche of high grade gliomas.
Some studies have shown the efficacy of M‐CSFR inhibitors in murine cancer models. Recently, the M‐CSFR inhibitor Ki20227 was shown to suppress tumor angiogenesis, lymphangiogenesis, and metastasis, and these effects were suggested to be caused by macrophage dysfunction.38 GW2580 inhibited the recruitment of myeloid cells into tumor tissues and combination therapy with an anti‐angiogenic agent significantly suppressed tumor growth.39, 40 These data indicate that blocking of M‐CSFR is effective as an anticancer therapy through abrogating the functions of myeloid cells.
In a previous study, we showed that the M2 ratio of TAMs is significantly associated with high tumor cell proliferation and poor clinical prognosis in patients with high grade glioma.6 As shown in Figure 6, the current study indicated that poor clinical prognosis was statistically significantly associated with higher M2 ratio, higher age, and higher MIB‐1(%), confirming observations consistent with the previous study. In addition, M‐CSFR activation in tumor cells was correlated with M‐CSF expression and MIB‐1(%) but not macrophage phenotype. These findings indicate that further studies are necessary to elucidate detailed mechanisms underlying the effects of cell–cell interaction in the glioma microenvironment.
Results showing that blocking M‐CSFR and Stat3 in macrophages suppressed tumor cell activation indicate that some soluble factors derived from activated macrophages contribute to tumor cell activation in coculture experiments. Although we were not able to identify macrophage‐derived soluble factors, it was previously reported that glioma‐derived factors enhanced Stat3 activity in microglia, and induced increased production of transforming growth factor‐β, IL‐6, and IL10 in a murine model.31 A selective Stat3 inhibitor and Stat3 siRNA reversed cytokine expression levels and suppressed tumor growth in vivo, indicating a major contribution of Stat3 signaling to immunosuppression by glioma‐derived factors.31, 32
In summary, results of the present study indicate that macrophage activation through M‐CSFR/Stat3 signals plays an important role in cell–cell interaction between macrophages and tumor cells. The M‐CSFR/Stat3 signals might be potential targets for therapeutic inhibition of macrophage‐related cell–cell interaction, an approach that may well prove promising for patients with high grade glioma.
Disclosure Statement
The authors have no conflict of interest.
Acknowledgments
We thank Ms Emi Kiyota, Mr Osamu Nakamura, and Ms Yui Hayashida (Department of Cell Pathology, Kumamoto University) for their technical assistance. This study was supported in part by Grants‐in‐Aid for Scientific Research (B20390113, 21790388) from the Ministry of Education, Culture, Sports, Science, and Technology of Japan.
(Cancer Sci 2012; 103: 2165–2172)
References
- 1. Pollard JW. Tumour‐educated macrophages promote tumour progression and metastasis. Nat Rev Cancer 2004; 4: 71–8. [DOI] [PubMed] [Google Scholar]
- 2. Sica A, Schioppa T, Mantovani A, Allavena P. Tumour‐associated macrophages are a distinct M2 polarised population promoting tumour progression: potential targets of anti‐cancer therapy. Eur J Cancer 2006; 42: 717–27. [DOI] [PubMed] [Google Scholar]
- 3. Gordon S. Alternative activation of macrophages. Nat Rev Immunol 2003; 3: 23–35. [DOI] [PubMed] [Google Scholar]
- 4. Jensen TO, Schmidt H, Moller HJ et al Macrophage markers in serum and tumor have prognostic impact in American Joint Committee on Cancer stage I/II melanoma. J Clin Oncol 2009; 27: 3330–7. [DOI] [PubMed] [Google Scholar]
- 5. Espinosa I, Beck AH, Lee CH et al Coordinate expression of colony‐stimulating factor‐1 and colony‐stimulating factor‐1‐related proteins is associated with poor prognosis in gynecological and nongynecological leiomyosarcoma. Am J Pathol 2009; 174: 2347–56. [DOI] [PMC free article] [PubMed] [Google Scholar]
- 6. Komohara Y, Ohnishi K, Kuratsu J, Takeya M. Possible involvement of the M2 anti‐inflammatory macrophage phenotype in growth of human gliomas. J Pathol 2008; 216: 15–24. [DOI] [PubMed] [Google Scholar]
- 7. Kurahara H, Shinchi H, Mataki Y et al Significance of M2‐polarized tumor‐associated macrophage in pancreatic cancer. J Surg Res 2009; 167: e211–9. [DOI] [PubMed] [Google Scholar]
- 8. Hasita H, Komohara Y, Okabe H et al Significance of alternatively activated macrophages in patients with intrahepatic cholangiocarcinoma. Cancer Sci 2010; 101: 1913–9. [DOI] [PMC free article] [PubMed] [Google Scholar]
- 9. Komohara Y, Hasita H, Ohnishi K et al Macrophage infiltration and its prognostic relevance in clear cell renal cell carcinoma. Cancer Sci 2011; 102: 1424–31. [DOI] [PubMed] [Google Scholar]
- 10. Niino D, Komohara Y, Murayama T et al Ratio of M2 macrophage expression is closely associated with poor prognosis for Angioimmunoblastic T‐cell lymphoma (AITL). Pathol Int 2010; 60: 278–83. [DOI] [PubMed] [Google Scholar]
- 11. Steidl C, Lee T, Shah SP et al Tumor‐associated macrophages and survival in classic Hodgkin's lymphoma. N Engl J Med 2010; 362: 875–85. [DOI] [PMC free article] [PubMed] [Google Scholar]
- 12. Nishie A, Ono M, Shono T et al Macrophage infiltration and heme oxygenase‐1 expression correlate with angiogenesis in human gliomas. Clin Cancer Res 1999; 5: 1107–13. [PubMed] [Google Scholar]
- 13. Hirano H, Tanioka K, Yokoyama S, Akiyama S, Kuratsu J. Angiogenic effect of thymidine phosphorylase on macrophages in glioblastoma multiforme. J Neurosurg 2001; 95: 89–95. [DOI] [PubMed] [Google Scholar]
- 14. Hussain SF, Yang D, Suki D, Aldape K, Grimm E, Heimberger AB. The role of human glioma‐infiltrating microglia/macrophages in mediating antitumor immune responses. Neuro Oncol 2006; 8: 261–79. [DOI] [PMC free article] [PubMed] [Google Scholar]
- 15. Zhai H, Heppner FL, Tsirka SE. Microglia/macrophages promote glioma progression. Glia 2011; 59: 472–85. [DOI] [PMC free article] [PubMed] [Google Scholar]
- 16. Yu H, Kortylewski M, Pardoll D. Crosstalk between cancer and immune cells: role of STAT3 in the tumour microenvironment. Nat Rev Immunol 2007; 7: 41–51. [DOI] [PubMed] [Google Scholar]
- 17. Yoshimura A. Signal transduction of inflammatory cytokines and tumor development. Cancer Sci 2006; 97: 439–47. [DOI] [PMC free article] [PubMed] [Google Scholar]
- 18. Abou‐Ghazal M, Yang DS, Qiao W et al The incidence, correlation with tumor‐infiltrating inflammation, and prognosis of phosphorylated STAT3 expression in human gliomas. Clin Cancer Res 2008; 14: 8228–35. [DOI] [PMC free article] [PubMed] [Google Scholar]
- 19. Page BD, Ball DP, Gunning PT. Signal transducer and activator of transcription 3 inhibitors: a patent review. Expert Opin Ther Pat 2011; 21: 65–83. [DOI] [PubMed] [Google Scholar]
- 20. Cheng F, Wang HW, Cuenca A et al A critical role for Stat3 signaling in immune tolerance. Immunity 2003; 19: 425–36. [DOI] [PubMed] [Google Scholar]
- 21. Wu L, Du H, Li Y, Qu P, Yan C. Signal transducer and activator of transcription 3 (Stat3C) promotes myeloid‐derived suppressor cell expansion and immune suppression during lung tumorigenesis. Am J Pathol 2011; 179: 2131–41. [DOI] [PMC free article] [PubMed] [Google Scholar]
- 22. Fujita M, Kohanbash G, Fellows‐Mayle W et al COX‐2 blockade suppresses gliomagenesis by inhibiting myeloid‐derived suppressor cells. Cancer Res 2011; 71: 2664–74. [DOI] [PMC free article] [PubMed] [Google Scholar]
- 23. Hussain SF, Kong LY, Jordan J et al A novel small molecule inhibitor of signal transducers and activators of transcription 3 reverses immune tolerance in malignant glioma patients. Cancer Res 2007; 67: 9630–6. [DOI] [PubMed] [Google Scholar]
- 24. Chihara T, Suzu S, Hassan R et al IL‐34 and M‐CSF share the receptor Fms but are not identical in biological activity and signal activation. Cell Death Differ 2010; 17: 1917–27. [DOI] [PubMed] [Google Scholar]
- 25. Takaishi K, Komohara Y, Tashiro H et al Involvement of M2‐polarized macrophages in the ascites from advanced epithelial ovarian carcinoma in tumor progression via Stat3 activation. Cancer Sci 2010; 101: 2128–36. [DOI] [PMC free article] [PubMed] [Google Scholar]
- 26. Horikawa T, Komohara Y, Kiyota E, Terasaki Y, Takagi K, Takeya M. Detection of guinea pig macrophages by a new CD68 monoclonal antibody, PM‐1K. J Mol Histol 2006; 37: 15–25. [DOI] [PubMed] [Google Scholar]
- 27. Komohara Y, Horlad H, Ohnishi K et al M2 macrophage/microglial cells induce activation of Stat3 in primary central nervous system lymphoma. J Clin Exp Hematop 2011; 51: 93–9. [DOI] [PubMed] [Google Scholar]
- 28. Sica A, Mantovani A. Macrophage plasticity and polarization: in vivo veritas. J Clin Invest 2012; 122: 787–95. [DOI] [PMC free article] [PubMed] [Google Scholar]
- 29. Baay M, Brouwer A, Pauwels P, Peeters M, Lardon F. Tumor cells and tumor‐associated macrophages: secreted proteins as potential targets for therapy. Clin Dev Immunol 2011; 2011: 565187. [DOI] [PMC free article] [PubMed] [Google Scholar]
- 30. Zheng Y, Cai Z, Wang S et al Macrophages are an abundant component of myeloma microenvironment and protect myeloma cells from chemotherapy drug‐induced apoptosis. Blood 2009; 114: 3625–8. [DOI] [PMC free article] [PubMed] [Google Scholar]
- 31. Zhang L, Alizadeh D, Van Handel M, Kortylewski M, Yu H, Badie B. Stat3 inhibition activates tumor macrophages and abrogates glioma growth in mice. Glia 2009; 57: 1458–67. [DOI] [PubMed] [Google Scholar]
- 32. Fujita M, Zhu X, Sasaki K et al Inhibition of STAT3 promotes the efficacy of adoptive transfer therapy using type‐1 CTLs by modulation of the immunological microenvironment in a murine intracranial glioma. J Immunol 2008; 180: 2089–98. [DOI] [PubMed] [Google Scholar]
- 33. Douglass TG, Driggers L, Zhang JG et al Macrophage colony stimulating factor: not just for macrophages anymore! A gateway into complex biologies. Int Immunopharmacol 2008; 8: 1354–76. [DOI] [PubMed] [Google Scholar]
- 34. Stein J, Borzillo GV, Rettenmier CW. Direct stimulation of cells expressing receptors for macrophage colony‐stimulating factor (CSF‐1) by a plasma membrane‐bound precursor of human CSF‐1. Blood 1990; 76: 1308–14. [PubMed] [Google Scholar]
- 35. Novak U, Harpur AG, Paradiso L et al Colony‐stimulating factor 1‐induced STAT1 and STAT3 activation is accompanied by phosphorylation of Tyk2 in macrophages and Tyk2 and JAK1 in fibroblasts. Blood 1995; 86: 2948–56. [PubMed] [Google Scholar]
- 36. Sherry MM, Reeves A, Wu JK, Cochran BH. STAT3 is required for proliferation and maintenance of multipotency in glioblastoma stem cells. Stem Cells 2009; 27: 2383–92. [DOI] [PMC free article] [PubMed] [Google Scholar]
- 37. Wu A, Wei J, Kong LY et al Glioma cancer stem cells induce immunosuppressive macrophages/microglia. Neuro Oncol 2010; 12: 1113–25. [DOI] [PMC free article] [PubMed] [Google Scholar]
- 38. Kubota Y, Takubo K, Shimizu T et al M‐CSF inhibition selectively targets pathological angiogenesis and lymphangiogenesis. J Exp Med 2009; 206: 1089–102. [DOI] [PMC free article] [PubMed] [Google Scholar]
- 39. Priceman SJ, Sung JL, Shaposhnik Z et al Targeting distinct tumor‐infiltrating myeloid cells by inhibiting CSF‐1 receptor: combating tumor evasion of antiangiogenic therapy. Blood 2010; 115: 1461–71. [DOI] [PMC free article] [PubMed] [Google Scholar]
- 40. Coniglio SJ, Eugenin E, Dobrenis K et al Microglial stimulation of glioblastoma invasion involves EGFR and CSF‐1R signaling. Mol Med 2012; 18: 519–27. [DOI] [PMC free article] [PubMed] [Google Scholar]


