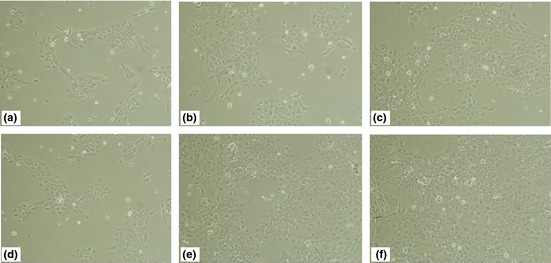
Figure 2.

Typical phase‐contrast images of cancerous HB cells treated with 0.8 μM CpG‐oligonucleotide for 24–72 h, taken using a light microscope. Images taken at 24 h (d), 48 h (e), and 72 h (f). Original magnification, ×100. Images of untreated HB cells at 24 h (a), 48 h (b), and 72 h (c) were used as the control. Original magnification, ×100.
