
Figure 3.
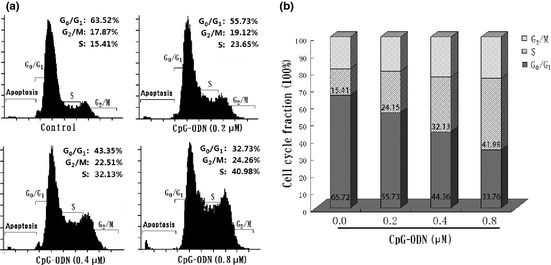
Effects of CpG‐oligonucleotides (CPG‐ODN) on HB cell cycle progression. (a) Representative flow histograms depicting cell cycle distribution in HB cells treated for 48 h with non‐CpG‐ODN (control) or CpG‐ODN (0.2–0.8 μM). (b) Cell cycle distribution in HB cells shows a decreased G 1 phase accompanied with the increased S phase after CpG‐ODN treatment. Results shown are the mean ± SD from three independent experiments. The fraction of cells in the G 0/G 1, S, and G 2/M phases are indicated.