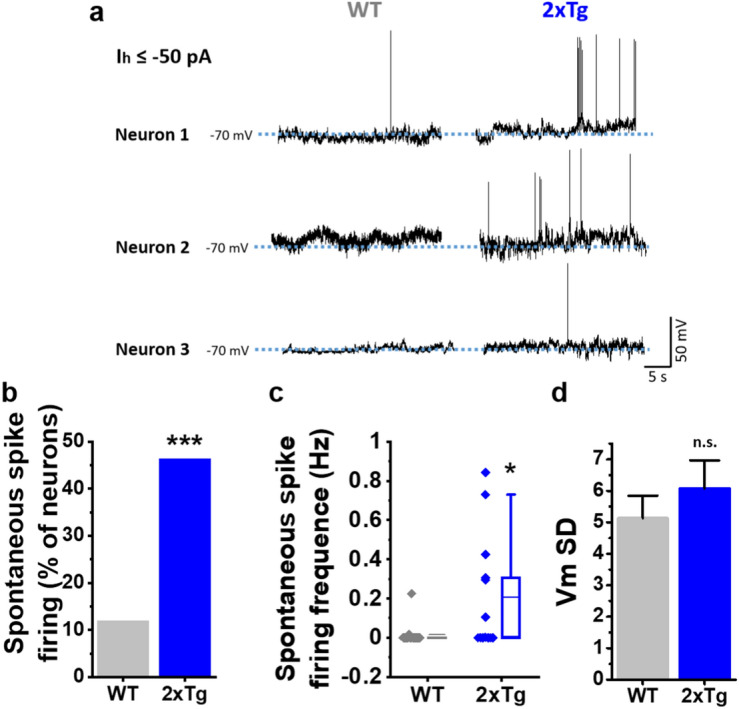
Figure 3.

Alterations of spontaneous excitability in isolated nAc neurons in 2xTg mice. (a) Membrane potential (Vm) recordings of 3 representative neurons for WT (grey) and 2xTg (blue). (b) Percentage of cells that exhibited spontaneous overshooting spikes during the recordings (χ2(1,30) = 6.211, p = 0.126). (c) Quantification of firing frequency of neurons that exhibited spontaneous spikes (U = 60, z-score = − 2.092, p = 0.0366). (d) Average Vm SD values for the different experimental conditions (t(28) = − 0.840, p = 0.407). Bar graphs represent the average ± SEM. *denotes p < 0.05 and ***p < 0.001 (Chi-square test for (b), Mann–Whitney-test for (c) and unpaired Student’s t-test for (d). Number of cells: WT = 17 and 2xTg = 13. Neurons obtained in at least 4 independent experiments. Number of mice: WT = 5 and 2xTg = 4.
