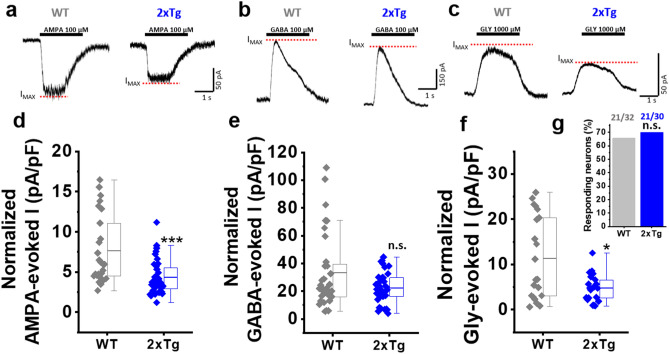
Figure 4.
Decreased excitatory and inhibitory post-synaptic receptors in the nAc of 2xTg. (a-c) Representative post-synaptic currents evoked by extracellular application of AMPA 100 µM (a), GABA 100 µM (b) and Glycine (Gly) 1000 µM (c) in WT and 2xTg mice. Segmented lines in red indicate the level of the maximum current reached (IMAX). (d-g) Quantification of the amplitude of the average evoked current (IMAX) by AMPA (d) (U = 209, z-score = -3.687, p = 1.1E-4), GABA (e) (U = 411, z-score = -0.564, p = 0.287) and Gly (f) (U = 144, z-score = -1.911, p = 0.028), as well as the percentage of neurons responding to Gly 1000 µM (g) (χ2(1,62) = 0.1356, p = 0.7126). Boxes indicate interquartile range (IQR); center lines, median; whiskers, 1.5 × IQR (interquartile range). * denotes p < 0.05, *** p < 0.001 (two-tailed Mann–Whitney test for (d–f) and Chi-square test for (g). Responding neurons for AMPA: WT (n = 26) and 2xTg (n = 36). GABA: WT (n = 32) and 2xTg (n = 36). Gly: WT (n = 21) and 2xTg (n = 21). Neurons obtained in at least 4 independent experiments (5 mice for WT and 4 mice for 2xTg).

