Figure 5.
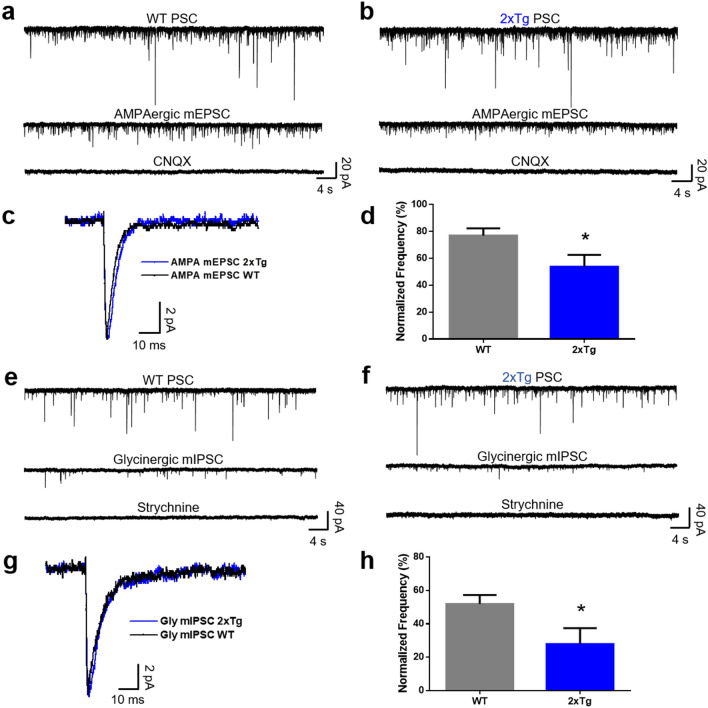
Decreased frequency of AMPAergic and glycinergic synaptic events. (a,b) Representative current traces of 1 min duration of synaptic activity in the nAc of WT and 2xTg mice, respectively. The first trace shows the total PSC, the second trace shows the isolated mEPSC mediated by AMPA receptors, and the third trace shows the blockade of the AMPA mEPSC by CNQX. (c) Average trace of the AMPA mEPSC in the nAc of WT (black trace) and 2xTg (blue trace) mice. (d) Graph shows the reduction of the normalized frequency of AMPAergic events in the 2xTg compared to WT mice (t(16) = 2.233, p = 0.0401). (e,f) Representative traces of 1 min duration of glycinergic synaptic activity in the nAc of WT and 2xTg mice, respectively. The first trace shows the total PSC, the second shows the isolated mIPSC mediated by GlyR, and the third trace shows the blockade of the glycinergic mIPSC by strychnine. (g) Average glycinergic mIPSC in the nAc of WT (black trace) and 2xTg (blue trace) mice. (h) Graph shows the reduction of the normalized frequency of glycinergic events in the 2xTg compared to WT mice (t(11) = 2.281, p = 0.0435). Data are mean ± SEM, unpaired Student’s t-test for (d,h), *p < 0.05, n = 9 WT and 9 2xTg for AMPA; n = 13 WT and 9 2xTg for glycine. Neurons obtained from at least 4 independent experiments. Number of mice: WT = 6 and 2xTg = 4.

