Figure 6.

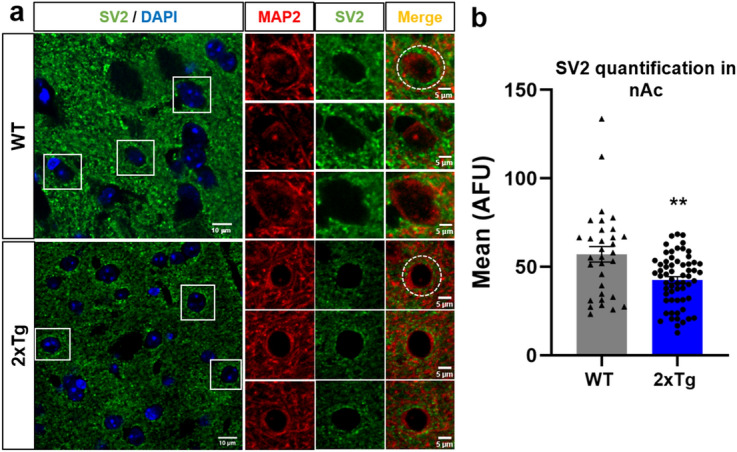
Reduced presence of SV2 in the nAc of 2xTg mice. (a) Immunostaining of coronal slices (30 μm) and high magnification images showing SV2 protein in the nAc from WT and 2xTg mice. (b) Quantification of SV2 fluorescence intensity in the soma of nAc neurons (dashed circles in (a) show regions of interest). Data are mean ± SEM and each data point reflects one soma. Unpaired Student’s t-test (t(90) = 3.243, **p = 0.0017). n = 3 WT and 2xTg mice. Images were analyzed with ‘ImageJ’ 1.8.0_112 (NIH), https://imagej.nih.gov/ij.
