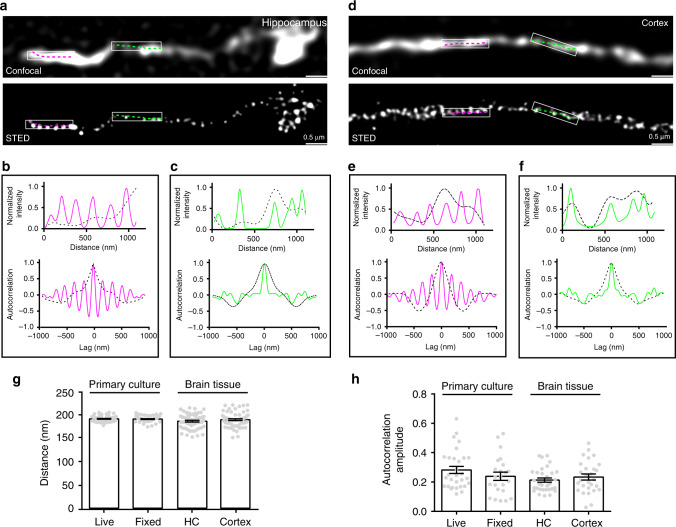
Fig. 1. Periodic hotspots of CB1 of varying strength in axons from brain tissue.
a Representative confocal and corresponding STED images of CB1 in the hippocampus of mature C57 mice. N = 3 biological replicates. b, c Intensity plotted along the lines in the box regions (top graph). Autocorrelation analysis for the confocal and STED images (bottom graph). d–f Similar to (a–c), but in the cortex region of mature C57 mice. N = 3 biological replicates. g Histogram of CB1 spacing in different samples, live and fixed hippocampal neurons, brain tissue of the hippocampus (HC) and cortex. Data are mean ± s.e.m. (N = 3 biological replicates; 70–120 axonal regions were examined per condition). p = 0.09, (no significance), one-way ANOVA. Actual spacing (from left to right), 192 ± 0.8 nm, 192 ± 0.8 nm, 187 ± 2 nm, 190 ± 2 nm. h Amplitude of the average autocorrelation functions calculated from randomly selected axon segments in different samples. p = 0.13 (no significance), one-way ANOVA. Actual autocorrelation amplitude (from left to right), 0.28 ± 0.02, 0.24 ± 0.03, 0.21 ± 0.01, 0.23 ± 0.02. Data in (g, h) are mean ± s.e.m. (N = 3 biological replicates; 70–120 axonal regions were examined per condition). Source data are provided as a Source Data file.

