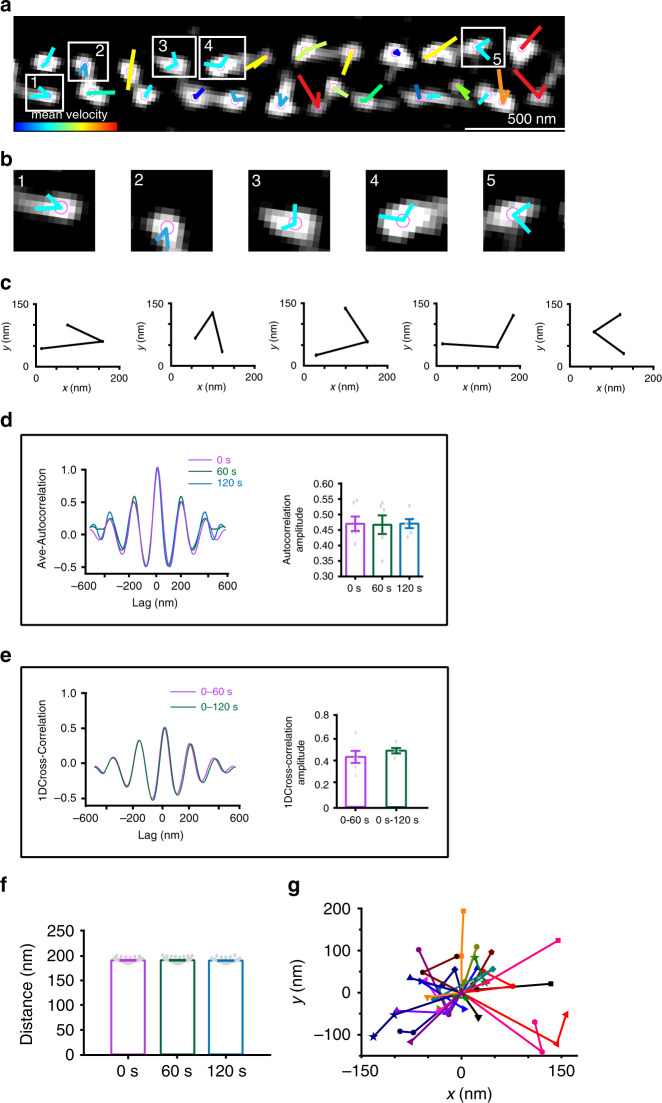
Fig. 3. Periodic CB1 hotspots display stable dynamics revealed by live SIM imaging.
a Representative live image of transfected CB1-RFP in the primary neuron (DIV 9–12) of the SD rat acquired by SIM. Individual CB1 hotspots are marked with purple balls, and locations of each individual time points are connected with lines. Line colors indicate trace indexes. N = 3 biological replicates. b Five CB1 hotspots shown in (a) with their relative locations. c Displacement changes from (b) are around 60–70 nm between neighboring time points. d Averaged autocorrelation analysis of CB1 distributions at different time points with the histogram of the autocorrelation amplitude. p = 0.99 (no significance), one-way ANOVA. Actual autocorrelation from left to right, 0.47 ± 0.02, 0.47 ± 0.03, 0.47 ± 0.02. e Averaged cross-correlation analysis between the neighboring frames (0 vs 60 s, 0 vs 120 s) showed similar distribution properties and histogram showing amplitude of average cross-correlation. p = 0.386 (no significance), statistical analysis was performed by unpaired two-tailed Student’s t test. Actual cross-correlation amplitude (from left to right), 0.45 ± 0.05; 0.51 ± 0.02. f The histogram of CB1 spacing across time points. p = 0.69 (no significance, one-way ANOVA). Actual spacing (from left to right), 192 ± 0.6, 192 ± 0.7, 191 ± 0.6 nm. Data in (d−f) are mean ± s.e.m. (N = 3 biological replicates; 70–120 axonal regions were examined per condition). g Traces of the individual CB1 hotspots over time. Source data are provided as a Source Data file.

