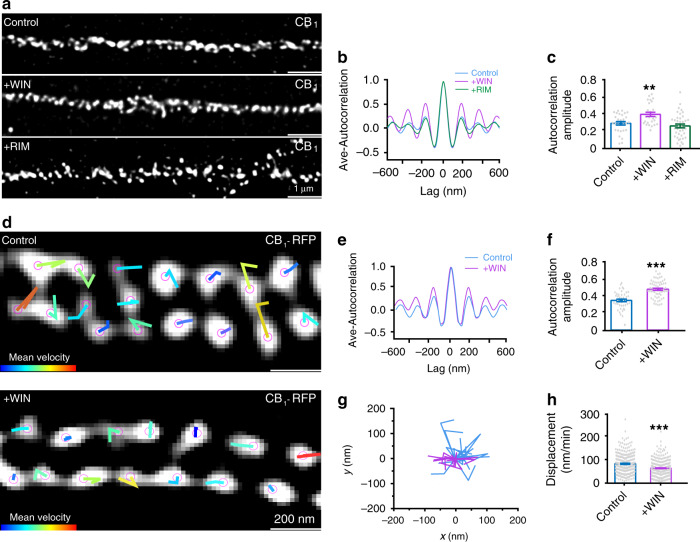
Fig. 4. The dynamics of active CB1 hotspots.
a Representative STED images of CB1 in primary hippocampal neurons for control, with WIN treatment (500 nM, 10 min) and RIM (1 µM, 10 min) treatment. N = 3 biological replicates. b Average autocorrelation analysis for the STED images of CB1 in different conditions. c The histogram of autocorrelation amplitude of CB1 (from left to right), 0.28 ± 0.02, 0.38 ± 0.02, 0.25 ± 0.02. p = 0.0003, **p < 0.01, one-way ANOVA. d Representative live image of transfected CB1-RFP in untreated neurons (top, “Control”), and neurons treated with WIN (bottom, “+WIN”) acquired by SIM. Individual CB1 hotspots are marked with purple balls, and locations of each individual time points are connected with lines. Line colors indicate trace indexes. N = 3 biological replicates. e Averaged autocorrelation analysis of CB1 distributions in live neurons. f The histogram of autocorrelation amplitude of CB1 without and with WIN treatment was shown. ***p < 0.0001, statistical analysis was performed by unpaired two-tailed Student’s t test. Actual autocorrelation amplitude (from left to right), 0.33 ± 0.02, 0.46 ± 0.01. g Traces the dynamics of CB1 hotspots without WIN treatment (magenta) and CB1 hotspots with WIN treatment (blue) over time. h The displacement of CB1 hotspots in different conditions. Control, 83.9 ± 2.5 nm/min. N = 291 spots. WIN, 64.6 ± 2.5 nm/min. N = 225 spots. ***p < 0.0001, statistical analysis was performed by unpaired two-tailed Student’s t test. Data in (c, f, h) are mean ± s.e.m. (N = 3 biological replicates; 70–120 axonal regions were examined per condition). Source data are provided as a Source Data file.

