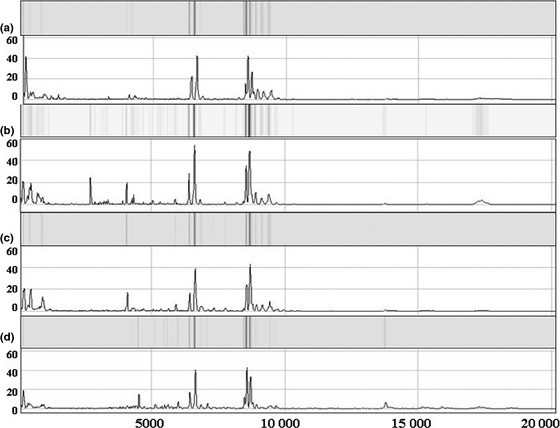
Figure 2.

Protein fingerprinting and corresponding electrophoretograms of four groups (a represents single case group with chip303‐C; b represents multiple cases family with chip10‐D; c represents normal control group with chip322‐F; d represents HBV positive control group with chip 203‐D). The m/z spectrum ranges from 5000 to 20 000 Da.
