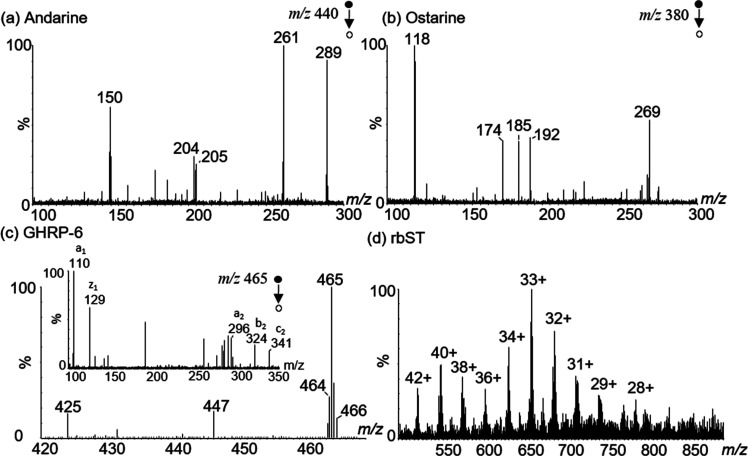
Figure 3.
USB–CBS mass spectra of aqueous solutions showing (a) negative ionization mode product ion scan of andarine (50 μg/L), (b) negative ionization mode product ion scan of ostarine (50 μg/L), (c) positive ionization mode full and product ion scans of [d-Lys3]-GHRP-6 (1.0 μg/mL), and (d) positive ionization mode full scan of intact rbST (30 μg/mL).

