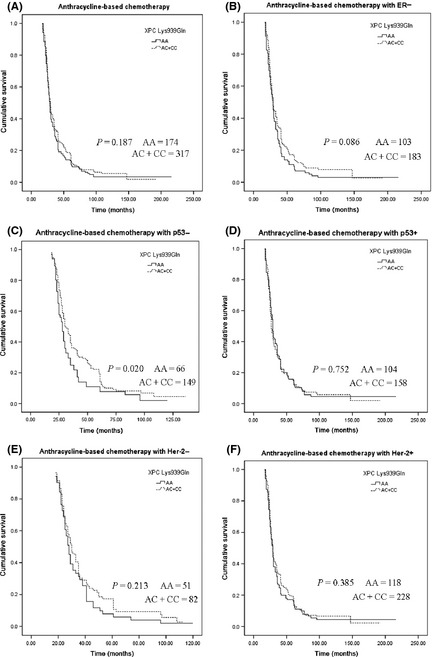
Figure 2.

Kaplan–Meier curves illustrating the overall survival of breast cancer patients who received anthracycline‐based neoadjuvant and/or adjuvant chemotherapy (A), patients with estrogen receptor (ER) positive status (B), p53 negative status (C), p53 positive status (D), Her‐2 negative status (E), and Her‐2 positive status (F).
