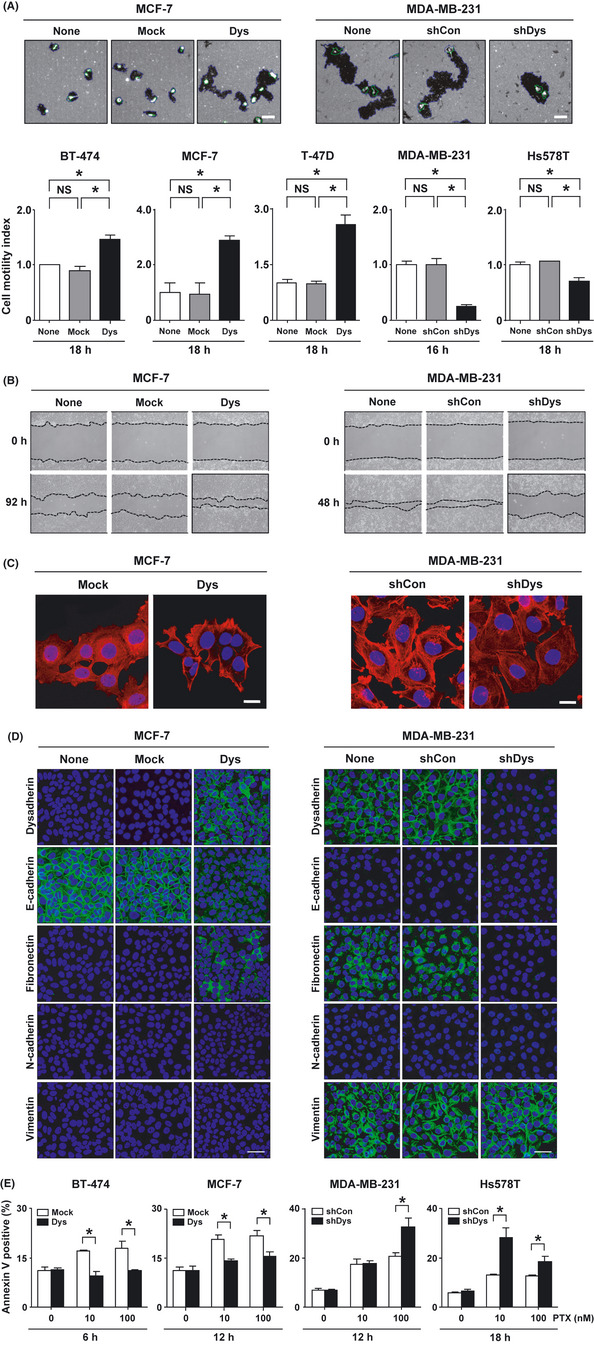
Figure 3.

Effect of dysadherin on cell motility, cell migration, actin organization, epithelial–mesenchymal transition (EMT) and anti‐apoptotic capacity in breast cancer cell lines. (A) Cell motility assay of breast cancer cells after modification of the Dysadherin gene. Blue line represents the track area of a cell. Green line represents the cell area. Data are the mean ± SD (n = 3). Scale bar, 100 µm. (B) Cell migration assay of breast cancer cells. Confluent cell cultures were scraped (“wounded”) with a micropipette tip (top). Cells were photographed at 48–92 h after wounding by phase contrast microscopy (bottom). (C) Immunofluorescent analysis of F‐actin in breast cancer cells. All nuclei were counterstained with DAPI (blue). Scale bar, 100 µm. (D) Immunofluorescent analysis of EMT‐related protein expression in breast cancer cells. All nuclei were counterstained with DAPI (blue). Scale bar, 50 µm. (E) Analysis of apoptosis in breast cancer cells after treatment with 10 and 100 nM paclitaxel (PTX) for 6–18 h. Apoptosis was measured using the annexin V assay. Data are the mean ± SD (n = 3). * P < 0.01. NS, not significant.
