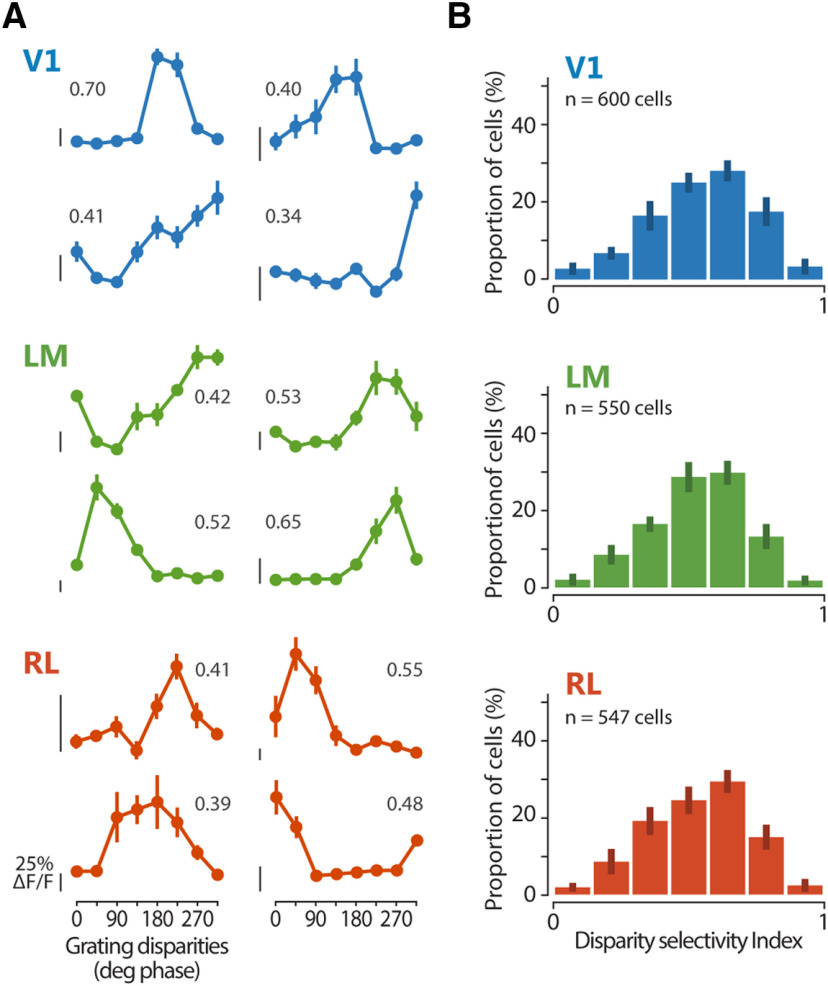
Figure 2.
Functional characterization of disparity-tuned neurons in areas V1, LM, and RL using dichoptic gratings. A, Example tuning curves for binocular disparity, each from a different cell located in one of areas V1, LM, and RL as indicated by the color code. The mean fluorescence response is plotted as a function of the eight grating disparities. Error bars indicate SEM across trials. For each cell, the DI is reported. Scale bars for neuronal response indicate 25% ΔF/F, with the bottom end of each scale bar indicating the baseline level (0% ΔF/F). B, Distributions of DI for each area. Mean of medians across planes ± SEM, V1, 0.57 ± 0.03; LM, 0.54 ± 0.02; RL, 0.55 ± 0.01.

