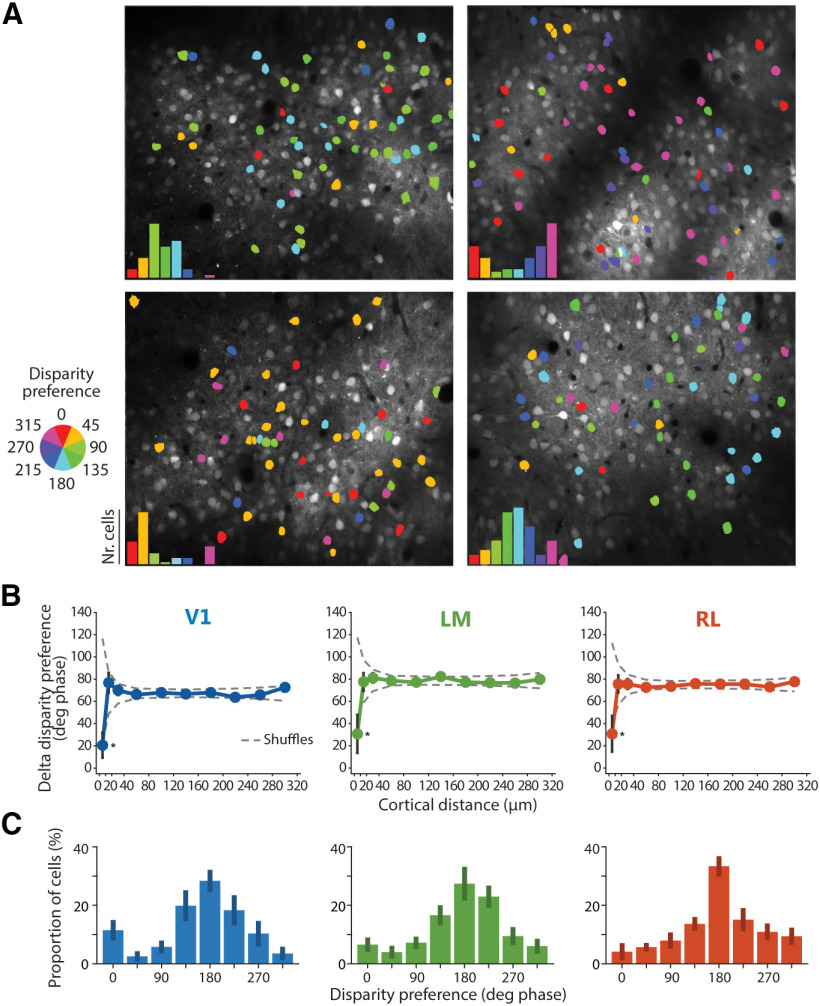
Figure 4.
Spatial and functional organization of disparity-tuned neurons. A, Example disparity maps from four different imaging planes, with neurons color-coded for disparity preference. Insets, disparity preferences show non-uniform distributions, with a population peak disparity characteristic for each individual experiment. B, Spatial organization for disparity tuning. Difference in disparity preference between every pair of disparity-tuned cells in each imaging plane plotted as a function of the cortical distance between cells. Plot lines and error bars indicate mean ± SEM across neurons. The dashed lines indicate the 95% confidence interval, as determined by random shuffles of disparity preferences and cell x,y positions in each imaging plane (*p < 0.05 at the 10-μm cortical distance bin). C, Peak aligned distributions of disparity preferences, averaged across experiments (V1, n = 8 imaging planes, 536 disparity-tuned cells total, 7 mice; LM, n = 7 imaging planes, 484 disparity-tuned cells total, 7 mice; RL, n = 6 imaging planes, 480 disparity-tuned cells total, 5 mice). The population peak was arbitrarily set to 180° phase.

