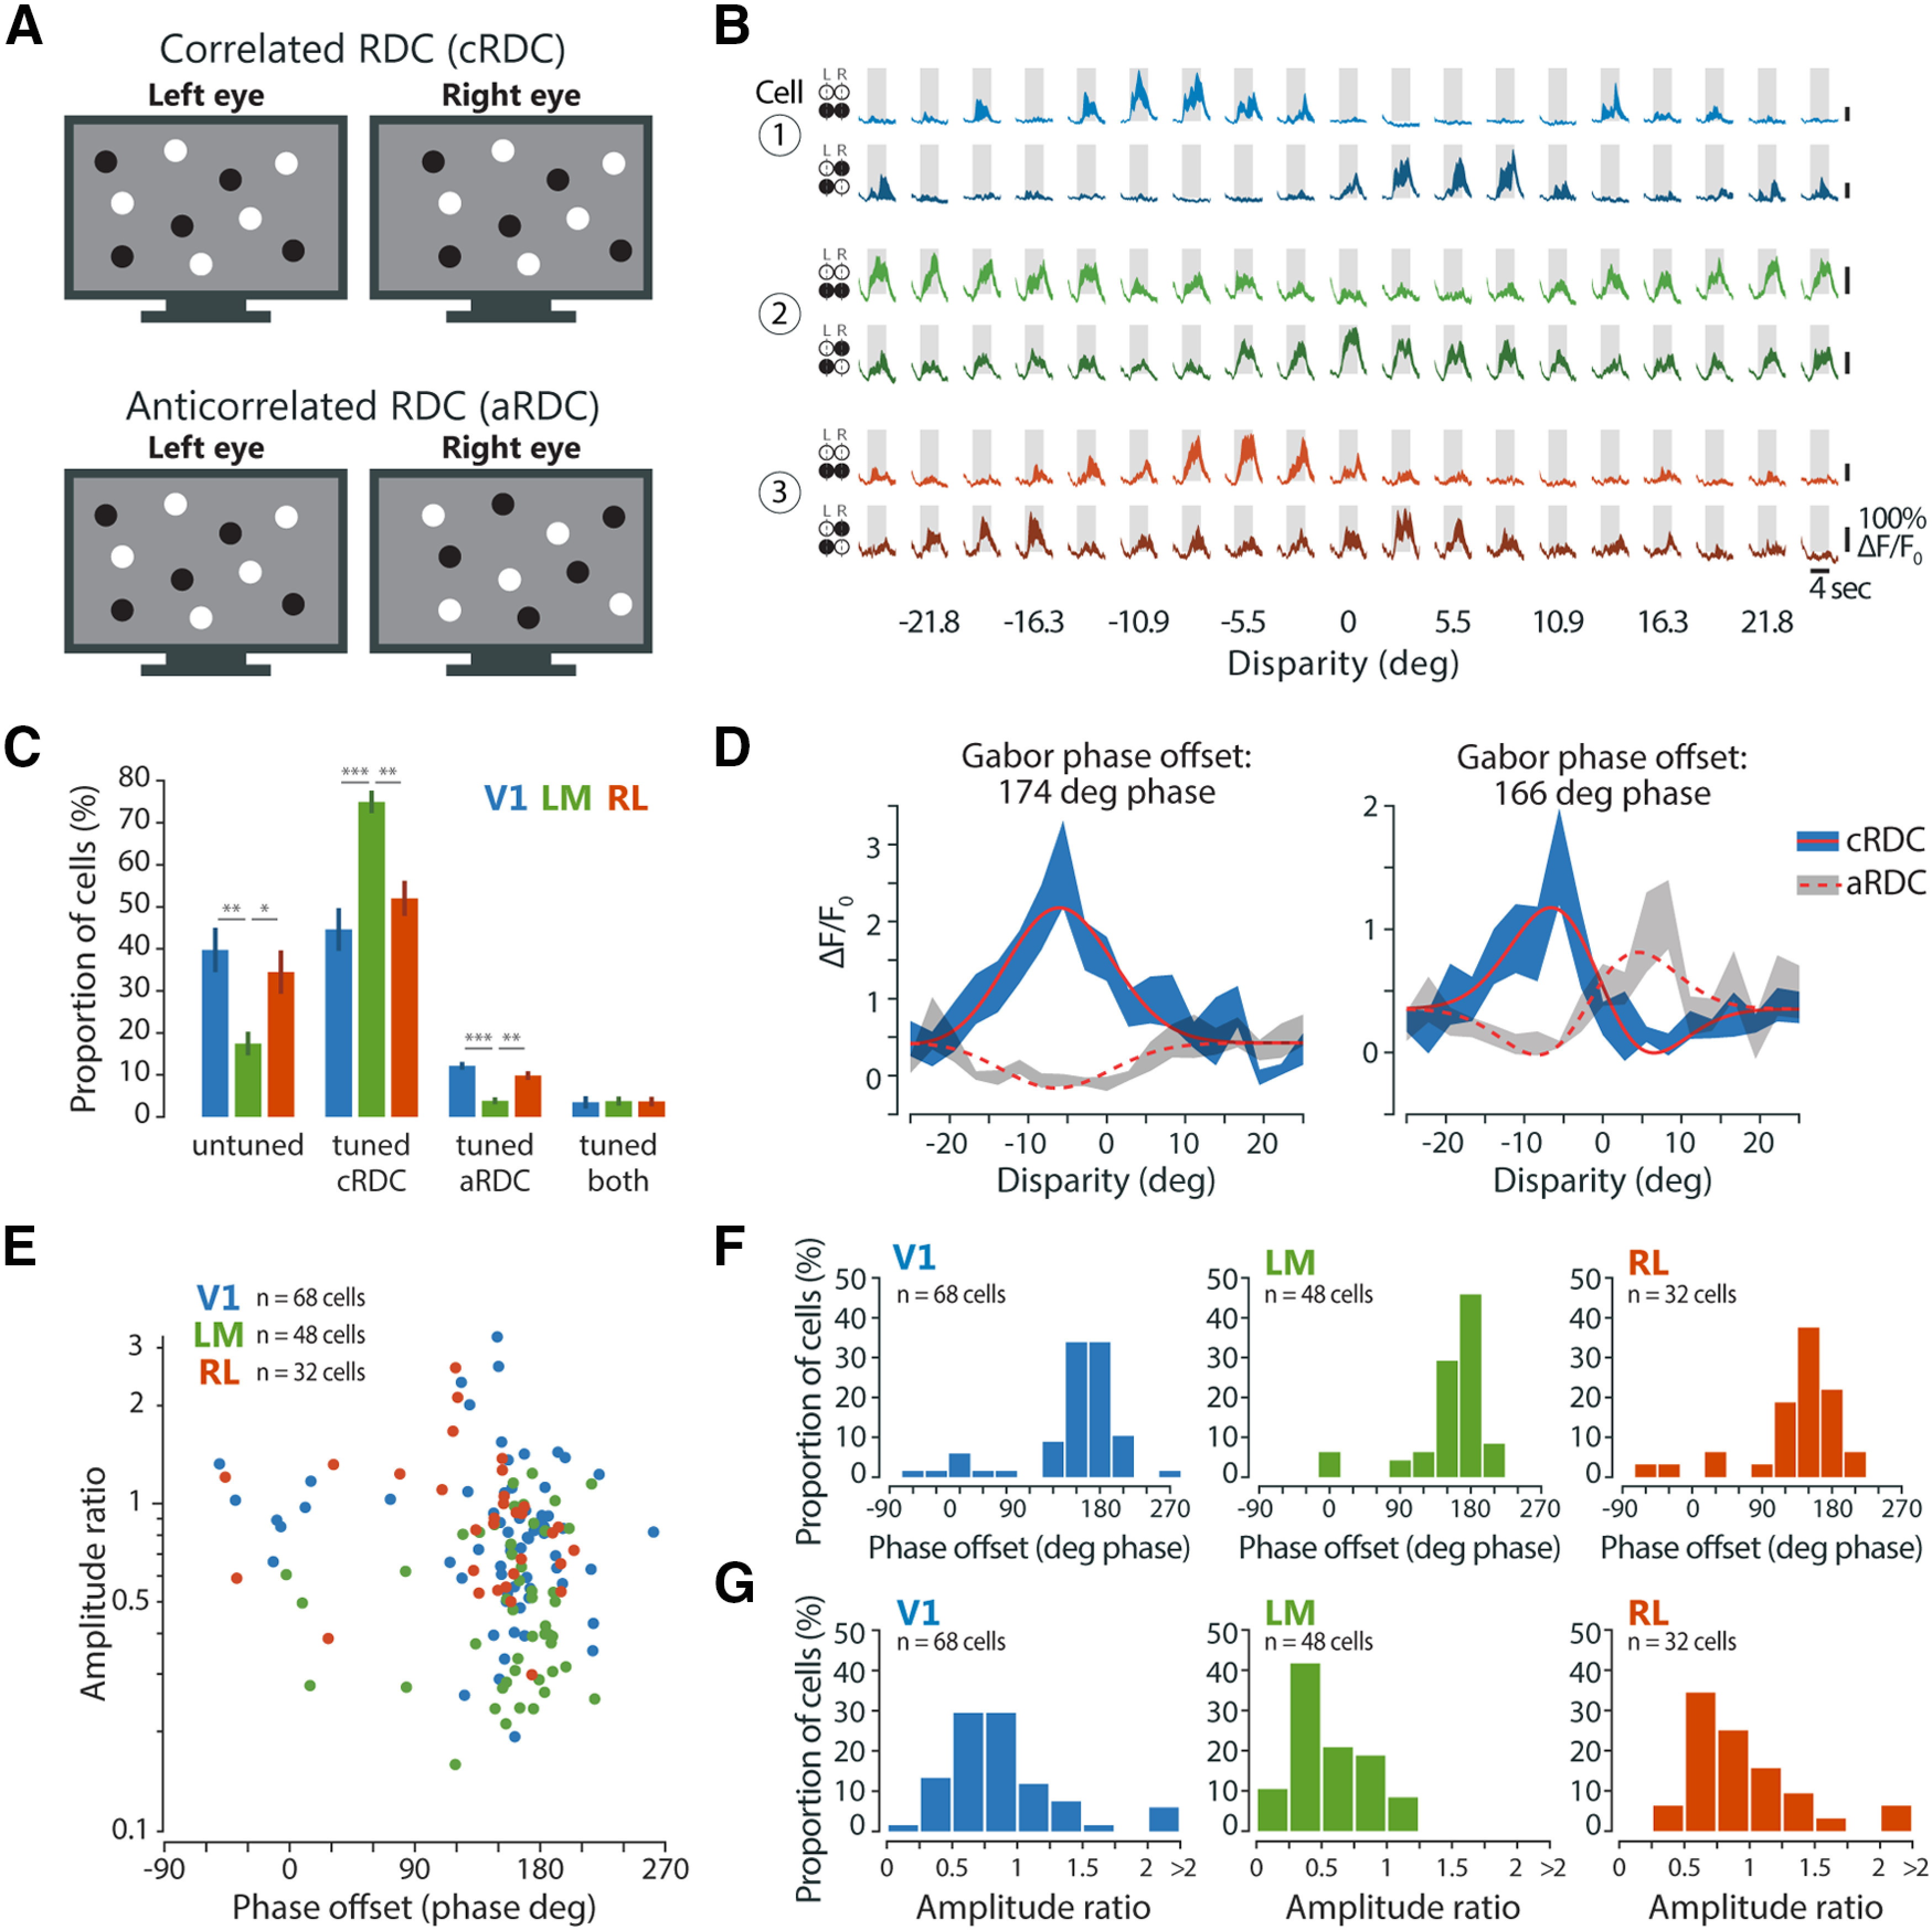
Figure 8.

Area-specific responses to aRDC. A, Schematic of cRDC and aRDC stimuli. B, Visually evoked calcium traces (ΔF/F0) of three example neurons, one from each area, in response to cRDC (upper traces, lighter shading) and aRDC (lower traces, darker shading). Fluorescence time courses are plotted as mean ΔF/F0 ± SEM (shaded areas) calculated across stimulus trials (10 repeats). Gray boxes, duration of stimulus presentation (4 s), bottom edge indicates baseline level (0% ΔF/F0). C, Percentage of disparity-tuned and untuned neurons, mean ± SEM across imaging planes. Statistical tests: Kruskal–Wallis test across areas for each tuning group separately, followed by Bonferroni-corrected Mann–Whitney tests, with asterisks denoting significance values of post hoc tests. D, Tuning curve fit with Gabor functions for two example neurons in response to cRDC (solid lines) and aRDC (dashed lines). Note tuning inversion between cRDC and aRDC, as indicated by a Gabor phase offset of around ±180° phase. E, Gabor amplitude ratio plotted against Gabor phase offset between cRDC and aRDC tuning curves, for individual neurons tuned to both stimuli (V1, n = 68 cells, 9 planes, 4 mice; LM, n = 48 cells, 8 planes, 3 mice; RL, n = 32 cells, 9 planes, 4 mice). F, Distributions of Gabor phase offset between cRDC and aRDC tuning curves for each area. G, Distributions of Gabor amplitude ratio between cRDC and aRDC tuning curves for each area.
