Figure 1.
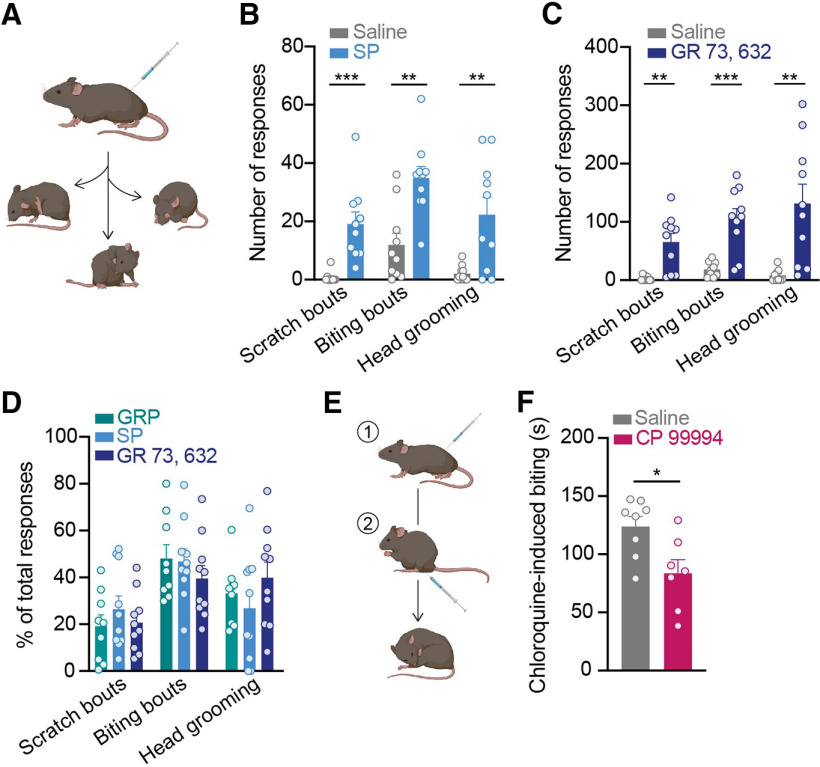
Spinal NK1R modulates itch. A, C57BL/6 mice were injected intrathecally with either saline, SP (400 ng), the selective NK1R agonist GR 73, 632 (40 ng), or GRP (285 ng), and three spontaneous itch-related behaviors were quantified: scratch bouts, biting bouts, and head grooming events. B, Intrathecal SP elicited significantly more scratch bouts, biting bouts, and head grooming responses than saline in the 5 min immediately following injection (Student's t test, Holm–Sidak correction for multiple comparisons, scratch bouts: ***p = 9.52 × 10⁻⁴, t = 4.44, df = 18, biting bouts: **p = 1.60 × 10⁻³, t = 4.02, df = 18, head grooming: **p = 3.58 × 10⁻³, t = 3.35, df = 18; n = 10 mice/group). C, Intrathecal GR 73, 632 significantly increased the number of scratch bouts, biting bouts, and head grooming responses compared with saline in the 20 min immediately following injection (Student's t test, Holm–Sidak correction for multiple comparisons, scratch bouts: **p = 2.01 × 10⁻³, t = 3.96, df = 17, biting bouts: ***p = 5.73 × 10⁻⁴, t = 4.74, df = 17, head grooming: **p = 2.66 × 10⁻³, t = 3.51, df = 17; n = 9–10 mice/group). D, The percentage of scratch bouts, biting bouts, and head grooming responses out of total responses to intrathecal injection of SP and GR 73, 632 were equivalent to that elicited by the well-established pruritogen, GRP (two-way ANOVA, behavioral response × agonist, p = 0.296, F(4,78) = 1.25, n = 9–10 mice/group). Behavioral responses to GRP were quantified for the 30 min immediately following injection. E, C57BL/6 mice were first injected intrathecally with either saline or the NK1R antagonist CP 99994 (18 μg); 15 min later, mice received an intradermal injection of chloroquine into the calf (100 μg/5 μl), and the duration of site-directed biting was quantified. F, Intrathecal pretreatment with CP 99994 significantly decreased the duration of chloroquine-induced biting compared with saline (Student's t test, *p = 0.016, t = 2.77, df = 13; n = 7–8 mice). SP, substance P; GRP, gastrin-releasing peptide. Data are shown as mean ± SEM, with open circles representing individual mice.

