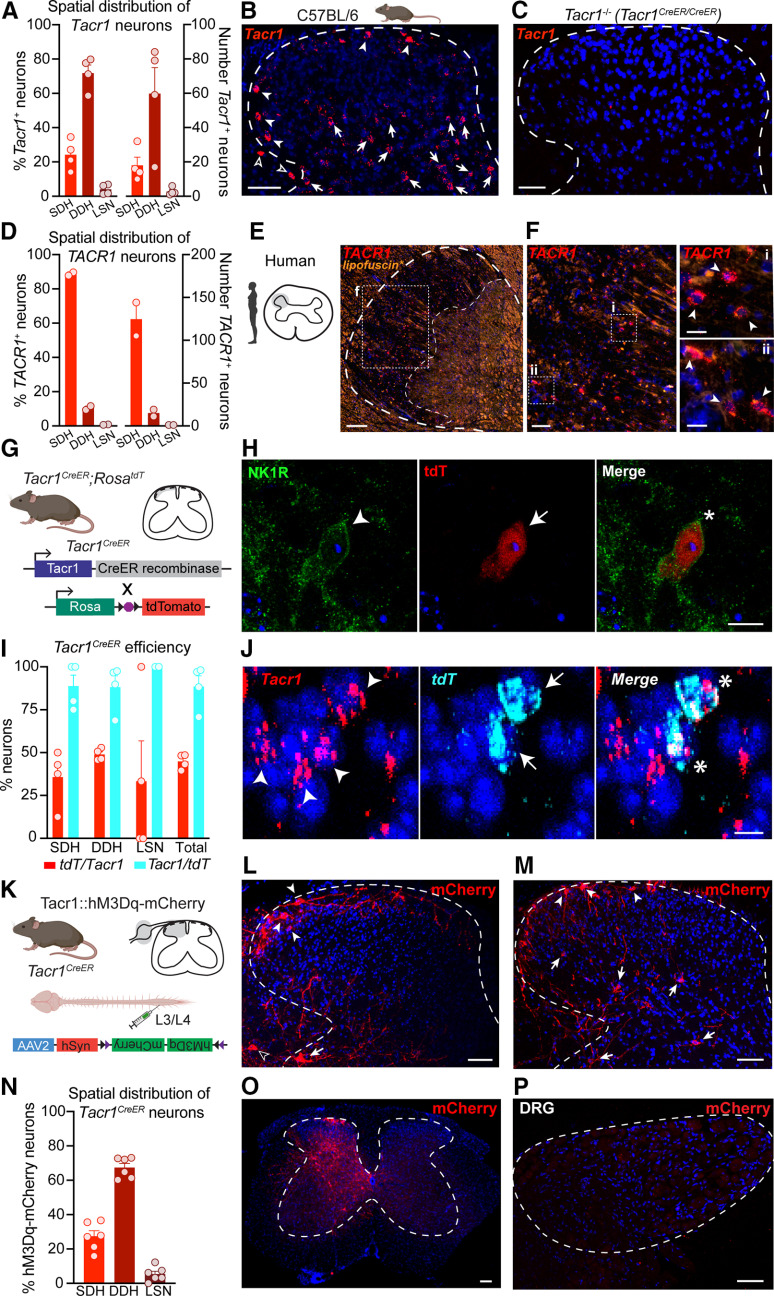
Figure 2.
Characterization of Tacr1 expression in mouse and human spinal cord dorsal horn. A, Percentage (left y-axis) and corresponding total number (right y-axis) of Tacr1 neurons located within the SDH, DDH, and LSN of the mouse lumbar spinal cord (n = 4 mice, 2–3 hemisections/mouse), visualized via (B) FISH in C57BL/6 mice. Filled arrowheads, SDH; filled arrows, DDH; empty arrowheads, LSN. C, No Tacr1 signal was detected by FISH in the lumbar spinal cord of Tacr1CreER/CreER mice, which are equivalent to NK1R−/− mice. Scale bars: 50 μm (B, C). D, Percentage (left y-axis) and corresponding total number (right y-axis) of TACR1 neurons located within the SDH, DDH, and LSN of the human cervical spinal cord (n = 2 donors, 3 hemisections/donor), visualized via (E, F) FISH. *Autofluorescence due predominantly to lipofuscin is shown to facilitate visualization of the substantia gelatinosa, bounded by the dotted lines. Scale bars: 250 μm (E), 50 μm (F), and 25 μm (Fi, Fii, insets). Filled arrowheads, SDH. G, To evaluate the efficiency and specificity of Tacr1CreER-mediated recombination within the lumbar spinal cord, Tacr1CreER;RosatdT mice were generated. H, Representative IHC image showing colocalization of NK1R immunoreactivity (green) and Tacr1CreER-mediated tdT expression (red) in an SDH neuron. Scale bar, 10 μm. Arrowhead or arrow, labeled neuron; Asterisk, dual-labeled neuron. I, Quantification of the colocalization of Tacr1 and tdT mRNA within SDH, DDH, and LSN neurons (n = 4 mice). J, Representative FISH image showing Tacr1CreER-mediated tdT mRNA expression (cyan) in Tacr1-expressing (red) spinal dorsal horn neurons. Scale bar, 10 μm. Arrowhead or arrow, labeled neuron; Asterisk, dual-labeled neuron. K, Tacr1CreER mice received intraspinal injections of the Cre-dependent virus AAV2-hSyn-DIO-hM3Dq-mCherry to determine whether Cre-mediated recombination recapitulated the spatial distribution of endogenous Tacr1 expression. L, M, Representative IHC images of the spatial distribution of hM3Dq-mCherry neurons (red) throughout the spinal cord dorsal horn. Filled arrowheads, SDH; filled arrows, DDH; empty arrowheads, LSN. Scale bars: 50 μm. N, Percentage of hM3Dq-mCherry neurons located within the SDH, DDH, and LSN of the lumbar spinal cord (n = 6 mice). O, Representative IHC image of the lumbar spinal cord showing that viral-vector-mediated Cre-dependent recombination in Tacr1CreER mice, indicated by mCherry expression (red), was largely restricted to the side ipsilateral to the intraspinal viral injection. Scale bar, 50 μm. P, Representative IHC image of the corresponding ipsilateral dorsal root ganglia (DRG), which lacks mCherry (red), indicating that viral vector-mediated Cre-dependent recombination was restricted to the spinal cord of Tacr1CreER mice. Scale bar, 50 μm. FISH, fluorescence in situ hybridization; SDH, superficial dorsal horn; DDH, deeper dorsal horn; LSN, lateral spinal nucleus. Data in A, D, I, N are shown as mean ± SEM, with open circles representing individual mice.

