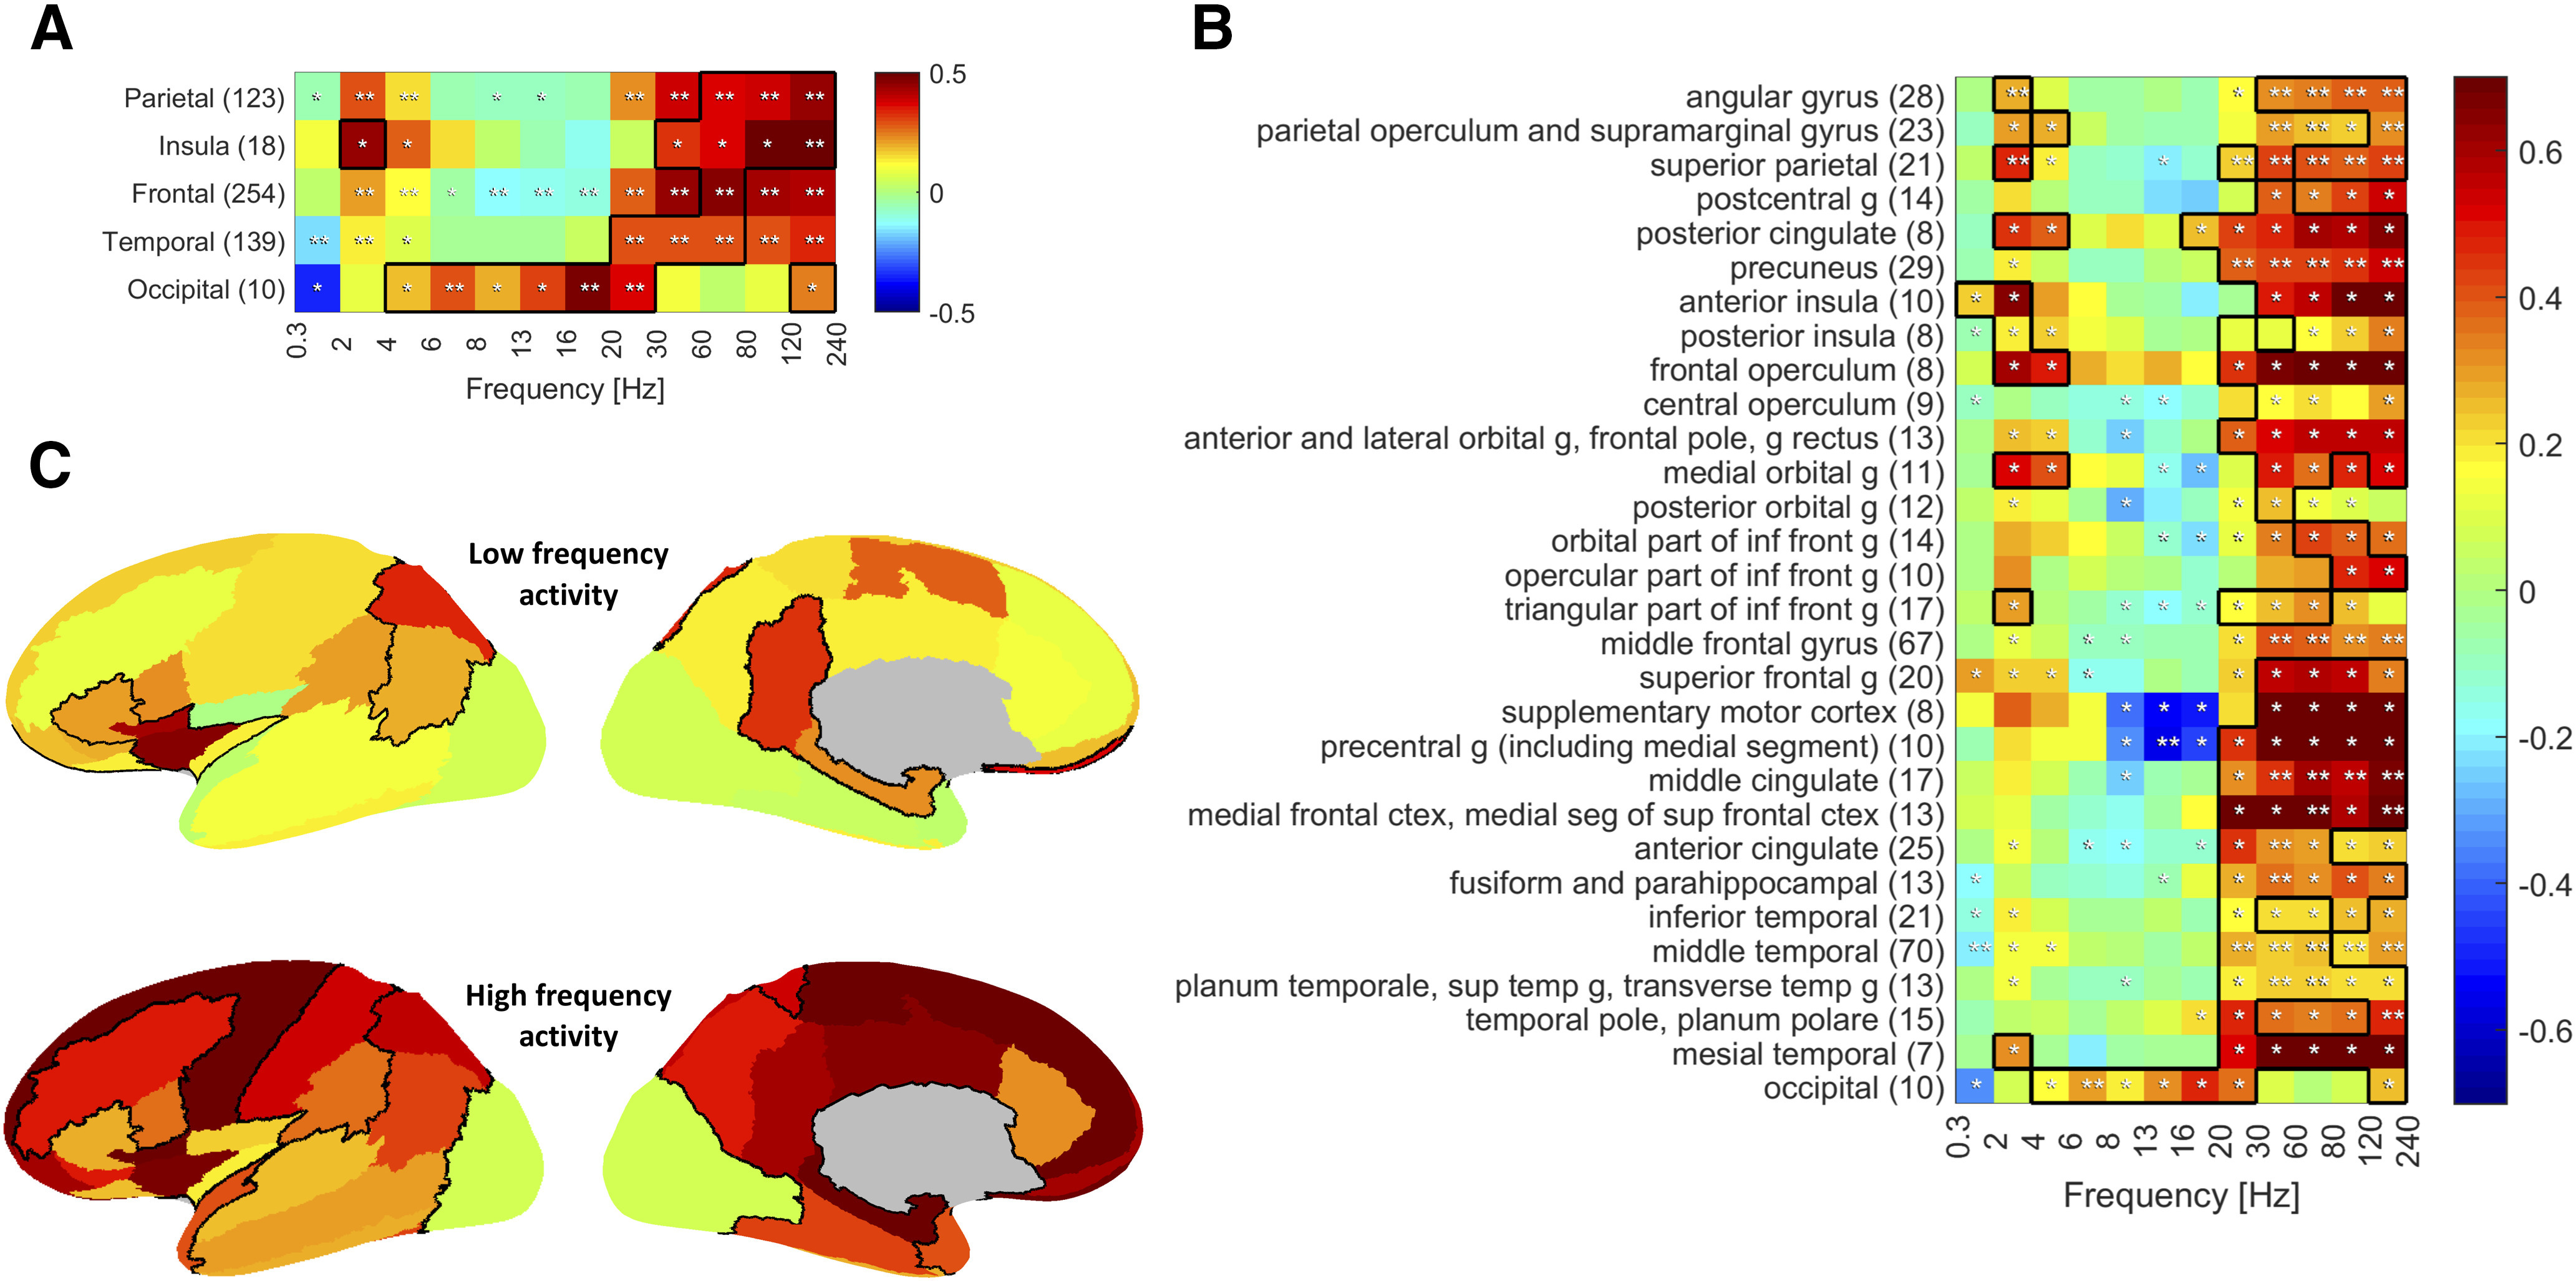
Figure 6.

Spectral changes in SEEG signal during scalp-detected STW according to brain area. Color represents the average z score of all channels in the region with respect to the control segments distribution. Black outline indicates a large effect size (Cohen's d > 0.8). A, Lobar scale. B, Sublobar scale. A significant increase in 2-4 Hz power during STW segments is observed in all lobes but the occipital lobe, with large effect size in the insular cortex. At the same time, a strong and significant increase in HF activity is observed in the same regions. When looking at the sublobar scale, we see that posterior parietal areas, including the parietotemporal junction, inferior frontal region, and anterior insula, are particularly involved in this δ activity. The increase in HF activity involves almost all areas, except for the occipital cortex. Average z score significantly different from zero: *uncorrected; **corrected). The number of channels averaged in each brain region is indicated in parentheses. C, Representation on the inflated cortex of the variation in LF (2-4 Hz, top) and HF (30-240 Hz, bottom) activity during scalp-detected STW with respect to control segments. Left, Lateral side; right, medial side. The channels of the left and right hemispheres are pooled together. Abbreviations: g, gyrus.
