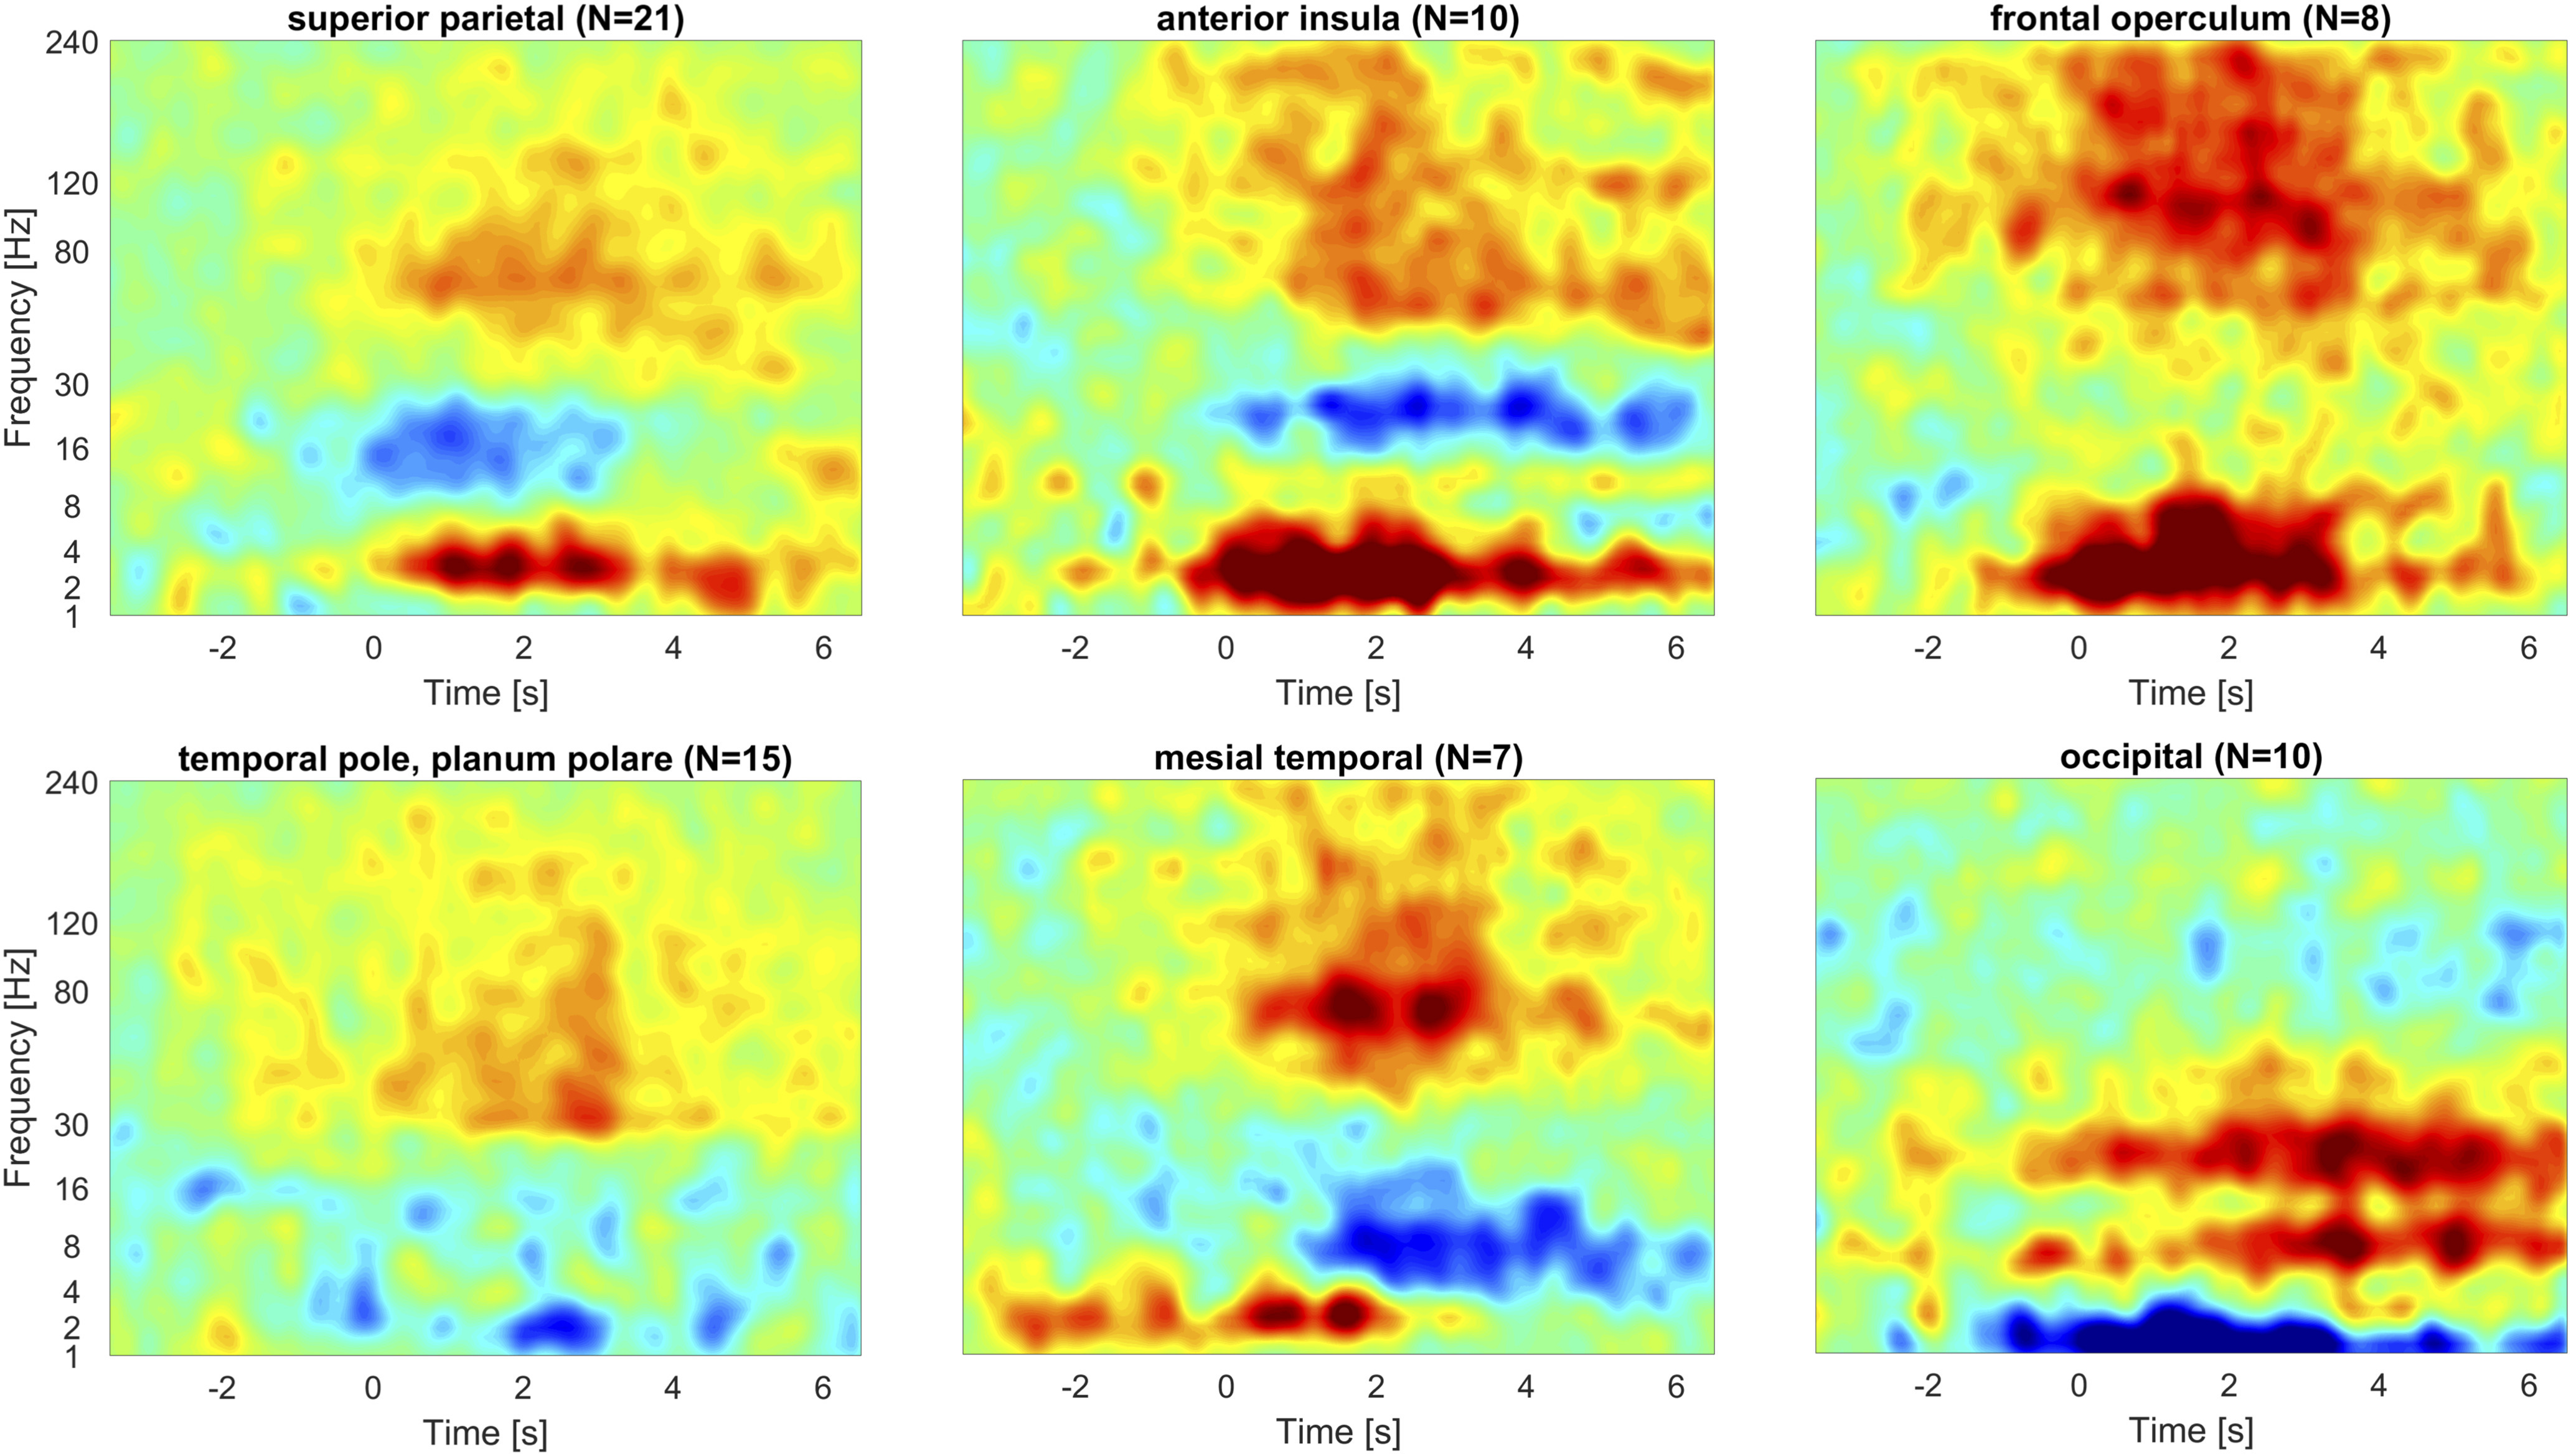
Figure 7.

Time-frequency representation of SEEG signal during STW and peri-STW segments. Time zero corresponds to the onset of the STW segment. Color scale represents the difference in average power compared with the average of control segments (for all cases, the scale goes from –0.5 to 0.5 dB). The number of averaged channels in each region is indicated in parentheses. In the superior parietal cortex, insula, frontal operculum, and to a less extent mesial temporal structures, an increase in both δ and γ band activity is observed, with ripple band activity observed in the anterior insula, frontal operculum, and mesiotemporal lobe. The temporal pole and planum polare mainly present with HF activity, and the occipital cortex exhibits a θ to β increase along with a decrease in slow waves.
