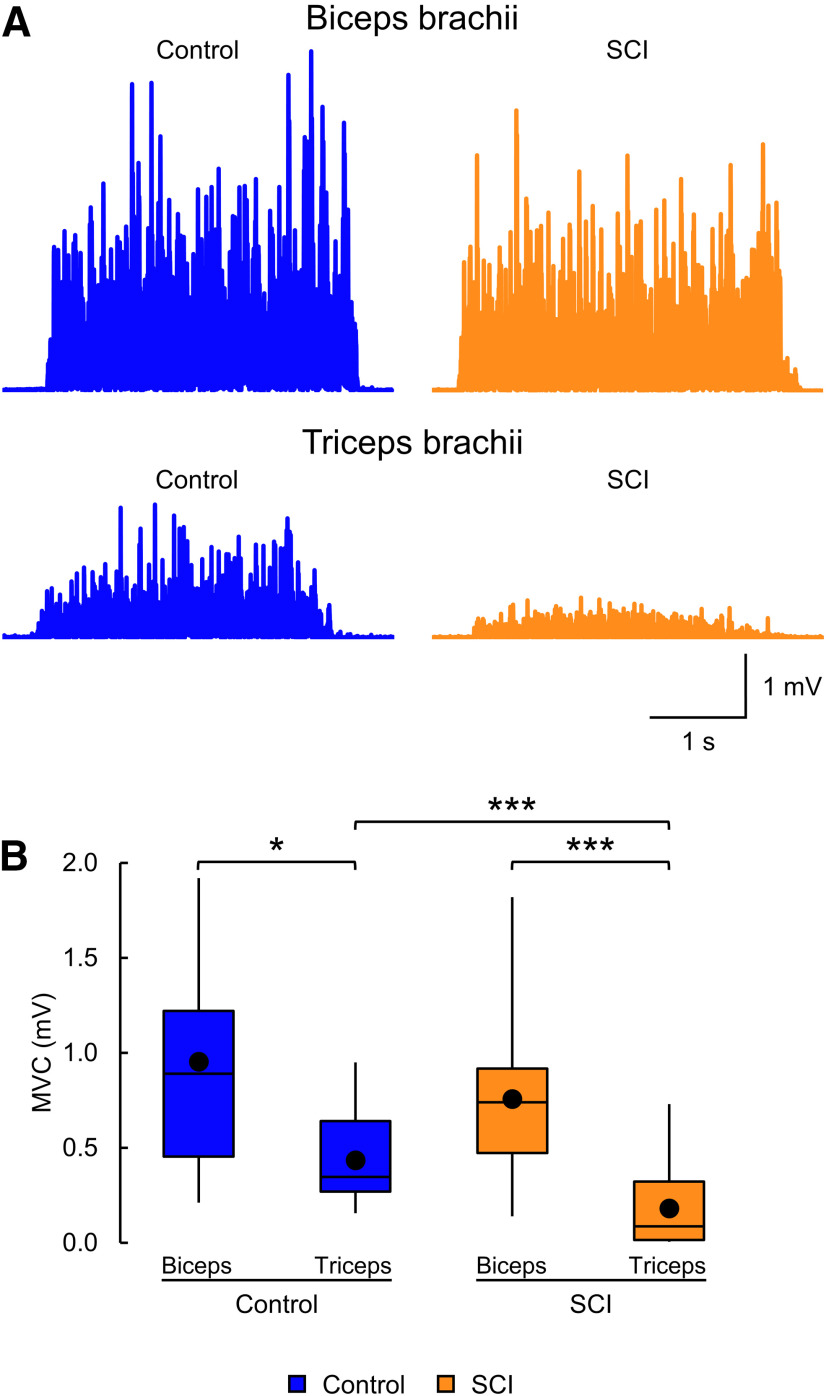
Figure 2.
MVCs. A, EMG recorded during biceps and triceps brachii MVCs in a control subject (blue) and a participant with SCI (orange). The SCI participant exhibited similar biceps MVC, but smaller triceps MVC, compared with the control subject. B, Box plot charts represent the group data. Abscissa indicates the groups tested (blue bars represent the control group; orange bars represent the SCI group). Ordinate indicates the MVC (in millivolts). Top and bottom lines of the box indicate the 75th percentile (top quartile) and 25th percentile (bottom quartile), respectively. Line in the box indicates the 50th percentile (median). The two bars extend from the maximum and minimum value. Dot within the box indicates the arithmetical mean. *p < 0.05, ***p < 0.001.

