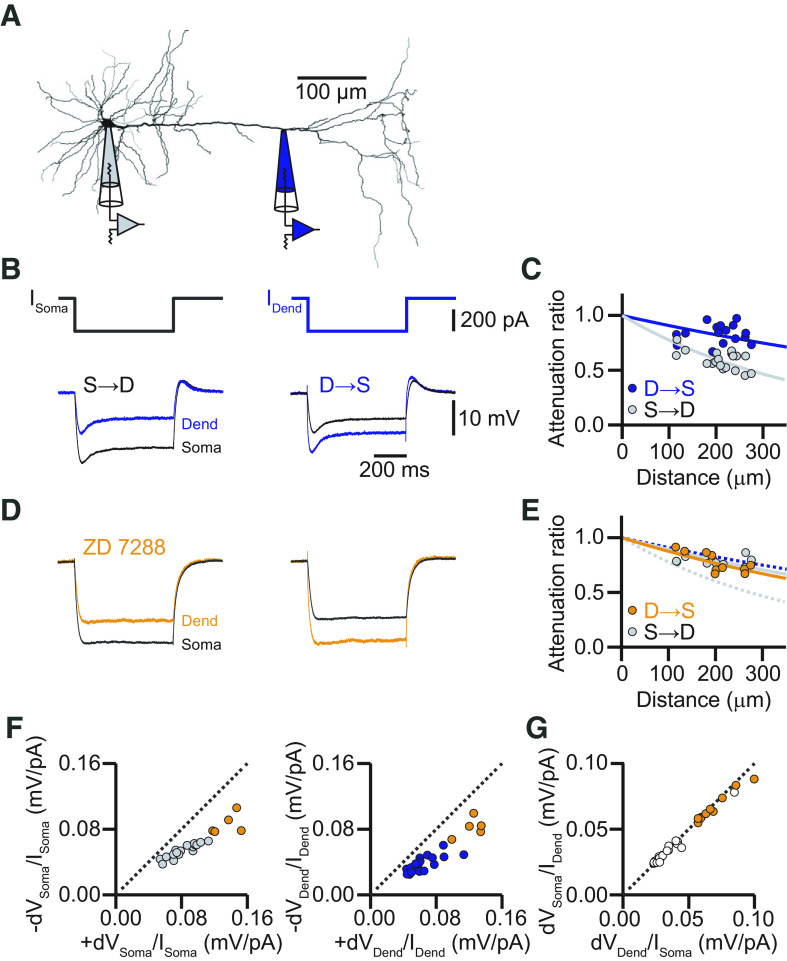
Figure 1.
Steady-state voltage attenuation along the apical dendrite of L5 pyramidal neurons in the ACC is small in the dendro-somatic direction. A, Neurolucida reconstruction of a biocytin-labeled L5 neuron in the ACC with the recording locations indicated. The dendritic recording had a distance of 262 μm from the soma. B, Voltage responses to somatic (left) and dendritic (right) current injections (600 ms, −300 pA). Somatic recordings are in black, and dendritic recordings are in blue. Resting membrane potential at the soma was −70 mV, and at the dendrite was −65 mV. C, Distance dependency of steady-state voltage attenuation for signals propagating from soma to dendrite (S→D, gray) and from dendrite to soma (D→S, blue). Solid lines represent exponential fits with effective length of constants of λS→D = 392 μm (gray) and λD→S = 1033 μm (blue). D, Voltage responses to somatic (left) and dendritic (right) current injections in the presence of the HCN channel blocker ZD-7288. Somatic recordings are in black, and dendritic recordings are in orange. Resting membrane potential at the soma was −80 mV, and at the dendrite was −75 mV. E, Distance dependency of steady-state voltage attenuation for signals propagating S→D (gray) and D→S (orange) in the presence of ZD-7288. Solid lines represent exponential fits with effective length constants of λS→D = 862 μm (gray) and λD→S = 750 μm (orange). Dashed lines indicate the corresponding fits determined in the control condition in C. F, Plot of voltage responses to hyperpolarizing current injections versus voltage responses to depolarizing current injections at the soma (left, gray circles) and the dendrite (right, blue circles). Orange circles represent responses in the presence of ZD-7288. The dashed unity line indicates equal responses to hyperpolarizing and depolarizing currents. The data points deviate from the unity line, indicating that the dendrites did not respond fully linearly. G, Plot of the steady-state voltage response amplitude at the soma to current injection at the dendrite versus steady-state voltage response amplitude at the dendrite to current injections at the soma. All data points (control, white; ZD-7288, orange) fall on the unity line, indicating reciprocity of the dendritic cable. Dend, Dendrite.

