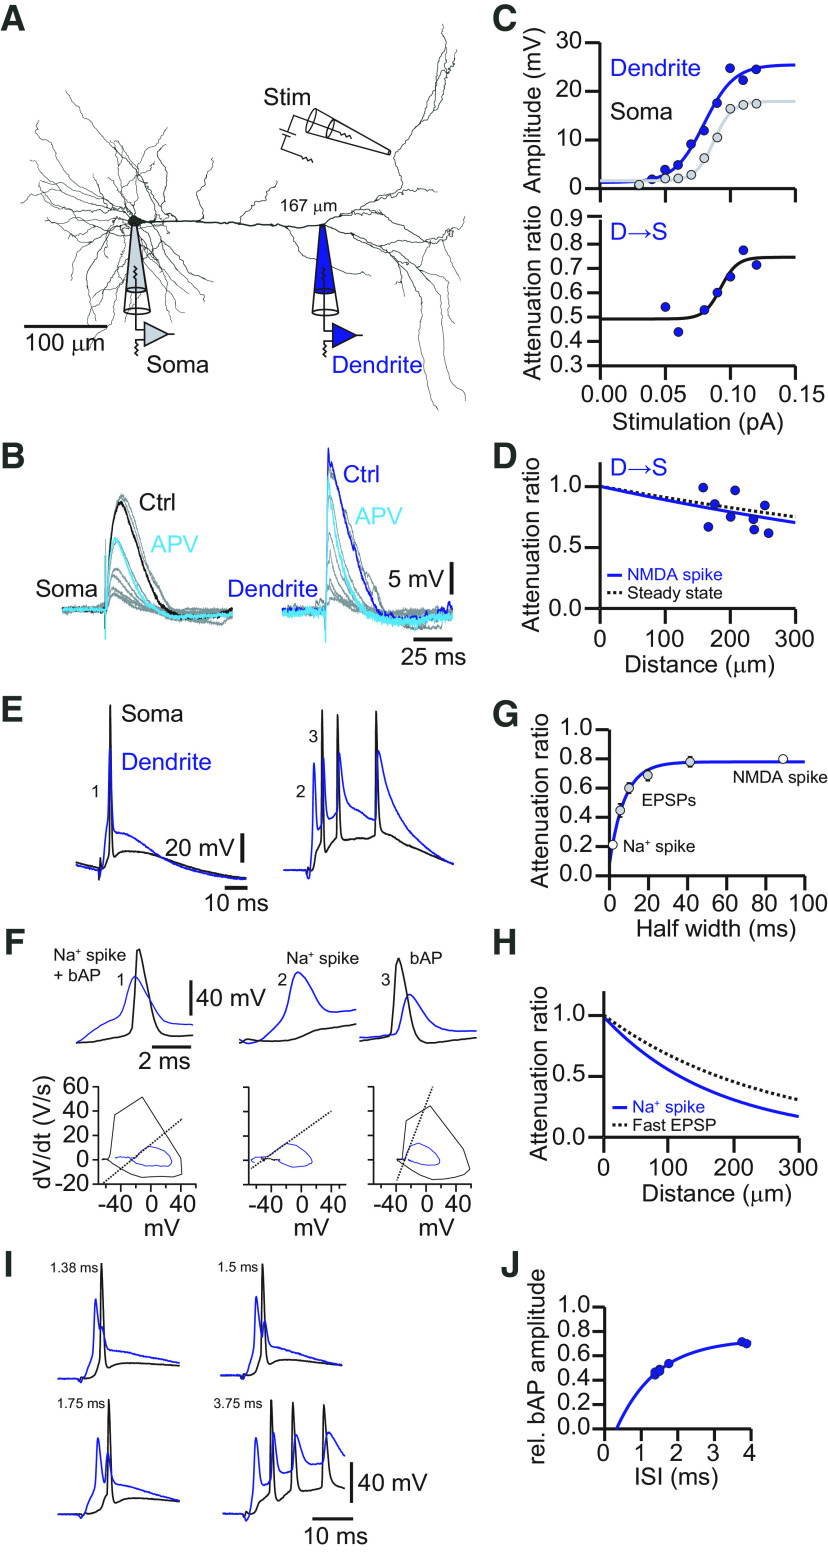
Figure 10.
Propagation of dendritic spikes in the apical dendrite. A, Neurolucida reconstruction of a biocytin-labeled L5 neuron in the ACC with the recording location indicated. The dendritic recording had a distance of 167 μm from the soma. An extracellular stimulation (Stim) pipette was placed close to a tuft dendrite. B, Voltage responses to increasing extracellular simulation strength recorded at the soma (left) and the apical dendrite (right). Bath application of the NMDA receptor antagonist APV reduced the suprathreshold plateau potentials at the soma [control (Ctrl), black; APV, turquoise] and the apical dendrite (Ctrl, blue; APV, turquoise) to a subthreshold EPSP, suggesting the presence of a NMDA spike in the control condition. C, EPSP amplitude versus extracellular stimulation strength. Dendritic (blue) and somatic (gray) amplitudes were fitted with a sigmoid function illustrating a nonlinear increase in EPSP amplitude with increasing stimulation strength. The lower graph shows the corresponding attenuation of the EPSP amplitude toward the soma versus stimulation strength. The solid line represents a sigmoid fit to the data points. The attenuation decreases concurrently with the occurrence of dendritic NMDA spikes. D, Attenuation of NMDA spikes versus distance from the soma. NMDA spikes were little attenuated toward the soma. The solid blue line represents an exponential fit to the data with an effective length constant of λ = 848 μm. The dashed black line represents the exponential fit to the attenuation of steady-state signals (λ =1033 μm). E, Example traces of synaptically evoked local Na+ spikes in the dendrite (blue) and the corresponding somatic response (black). F, Example traces from E on an expanded timescale, as indicated by the corresponding numbers. Left, The dendritic Na+ spike precedes a somatic AP. Middle, Isolated dendritic Na+ spike that is strongly attenuated toward the soma. Right, Somatic AP that backpropagates to the dendritic recording site. Local dendritic Na+ spikes can be distinguished from bAPs by a different rising slope, as indicated by the dV/dt-Vm plot shown below the corresponding traces. G, Plot of attenuation versus half-width of the event. Na+ spikes were the shortest dendritic membrane depolarizations and correspondingly were strongly attenuated. In contrast, NMDA spikes were long lasting and much less attenuated. H, Attenuation of Na+ spikes versus distance from the soma. Na+ spikes were strongly attenuated toward the soma. The solid blue line represents an exponential fit to the data with an effective length constant of λ = 173 μm. The dashed black line represents the exponential fit to the attenuation of the fastest EPSPs (λ =236 μm). I, Example traces of dendritic Na+ spikes (blue) followed by a somatic AP (black) that backpropagated to the dendritic recording site. Depending on the timing of Na+ spike and AP, the amplitude of the bAP in the dendrite was modulated, presumably because of the refractory period of voltage-dependent Na+ channels. J, Plot of the relative bAP amplitude versus the interspike interval (ISI) between dendritic Na+ spike and the bAP.

