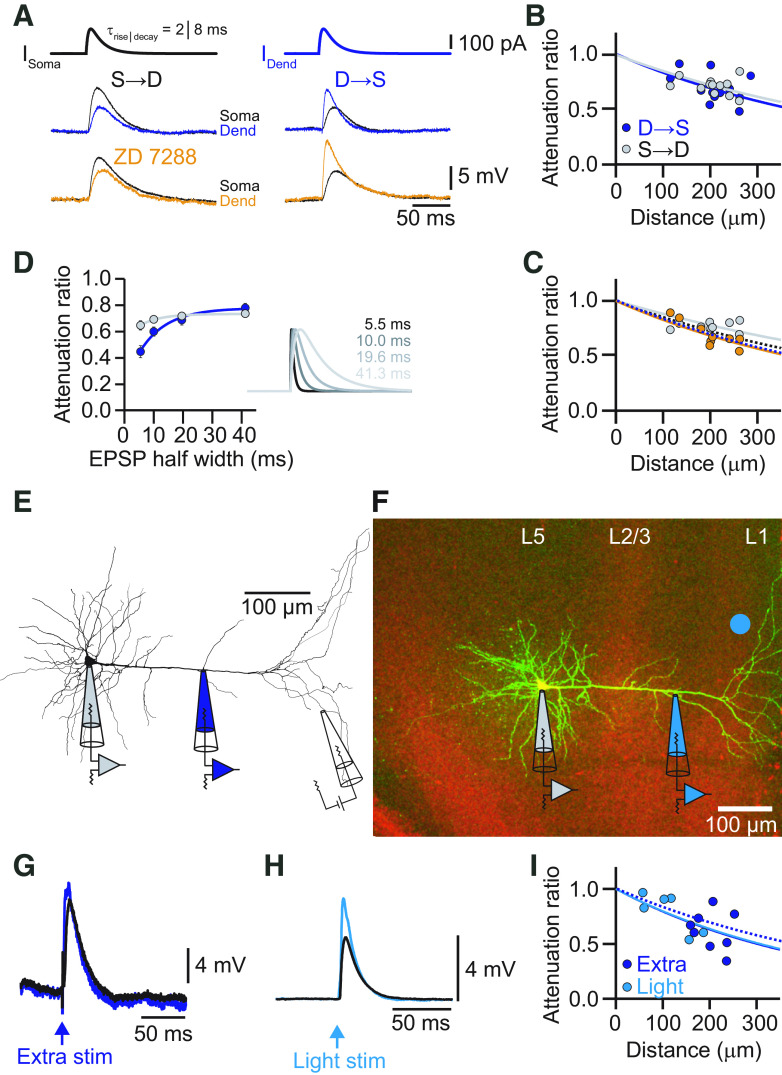
Figure 2.
EPSP attenuation in the apical dendrite of ACC L5 pyramidal neurons. A, Voltage responses to somatic (left) and dendritic (right) current injections of EPSP-like currents (τrise = 2 ms, τdecay = 8 ms) from the cell shown in Figure 1. Somatic recordings are in black. Dendritic recordings in the control condition are in blue, and in the presence of ZD-7288 in orange. Note the moderate attenuation of the EPSP amplitude from dendrite to soma. B, Distance dependency of EPSP attenuation for signals propagating S→D (gray) and D→S (blue). Solid lines represent exponential fits with effective lengths constants of λS→D = 622 μm (gray) and λD→S = 539 μm (blue). C, Distance dependence of EPSP amplitude attenuation for signals propagating S→D (gray) and D→S (orange) in the presence of ZD-7288. Solid lines represent exponential fits to the data points. Dashed lines indicate the corresponding fits determined in the control condition in B. D, Plot of the average voltage attenuation of injected EPSP-like currents with different kinetics as a function of the corresponding EPSP half-width. On the right, τrise, τdecay, and the corresponding half-width are indicated. E, Neurolucida reconstruction of a biocytin-labeled L5 neuron in the ACC with the recording locations indicated. The dendritic recording had a distance of 185 μm from the soma. EPSPs were evoked by an extracellular stimulation electrode placed close to the tuft dendrites. F, Confocal fluorescence image of an L5 pyramidal neuron in the ACC in green and the ChR2-positive axons from the contralateral ACC in red. The dendritic recording was a distance of 248 μm from the soma. The blue dot indicates the site of optogenetic stimulation with blue light in L1. G, Synaptically evoked EPSP by extracellular electrical stimulation recorded at the dendrite (blue) and the soma (black). H, Optogenetically evoked EPSP recorded at the dendrite (light blue) and the soma (black). I, Distance dependency of EPSP amplitude attenuation for signals propagating from dendrite to soma for electrically (blue) and optogenetically (light blue) evoked EPSPs. Solid lines represent exponential fits to the data points. The dashed line indicates the exponential fit to the dendrite-to-soma attenuation of an injected EPSP-like current (τrise = 2 ms, τdecay = 8 ms) from B. Note that electrical and light-evoked EPSPs yielded identical attenuation profiles. Stim, Stimulation.

