Figure 9.
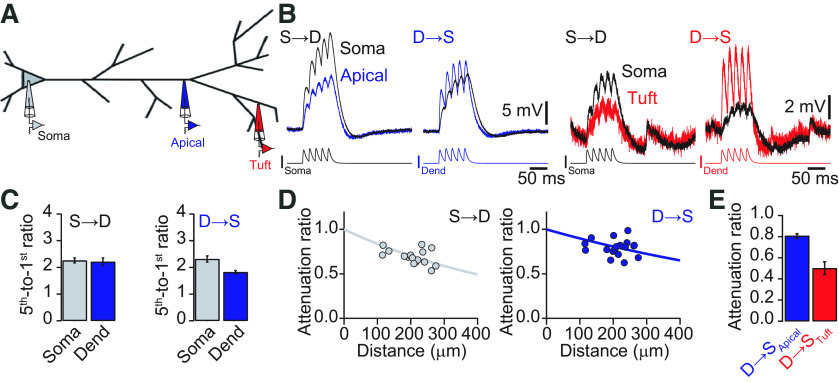
Temporal summation and propagation of EPSPs. A, Schematic of recording configurations of either simultaneous soma–apical dendrite or soma–tuft dendrite recordings. B, Voltage recordings at the soma (black), apical dendrite (blue), and tuft dendrite (red) in response to EPSP-like current injections of five EPSPs (τrise = 2 ms, τdecay = 8 ms) at 50 Hz in the soma (S→D) or dendrite (D→S). Note, that the burst of EPSPs injected into the apical dendrite propagates very well toward the soma, whereas the same pattern injected into the tuft is considerably attenuated. C, Bar graphs quantifying the temporal summation of the five EPSPs. Temporal summation is in all cases sublinear. D, Attenuation of the peak amplitude of five EPSPs versus distance from the soma in soma-to-dendrite (left) and dendrite-to-soma (right) directions. Solid lines represent exponential fits to the data. E, Bar graph of the average attenuation of the peak amplitude of five EPSPs from apical dendrite (blue) and tuft dendrite (red). Dend, Dendrite.

