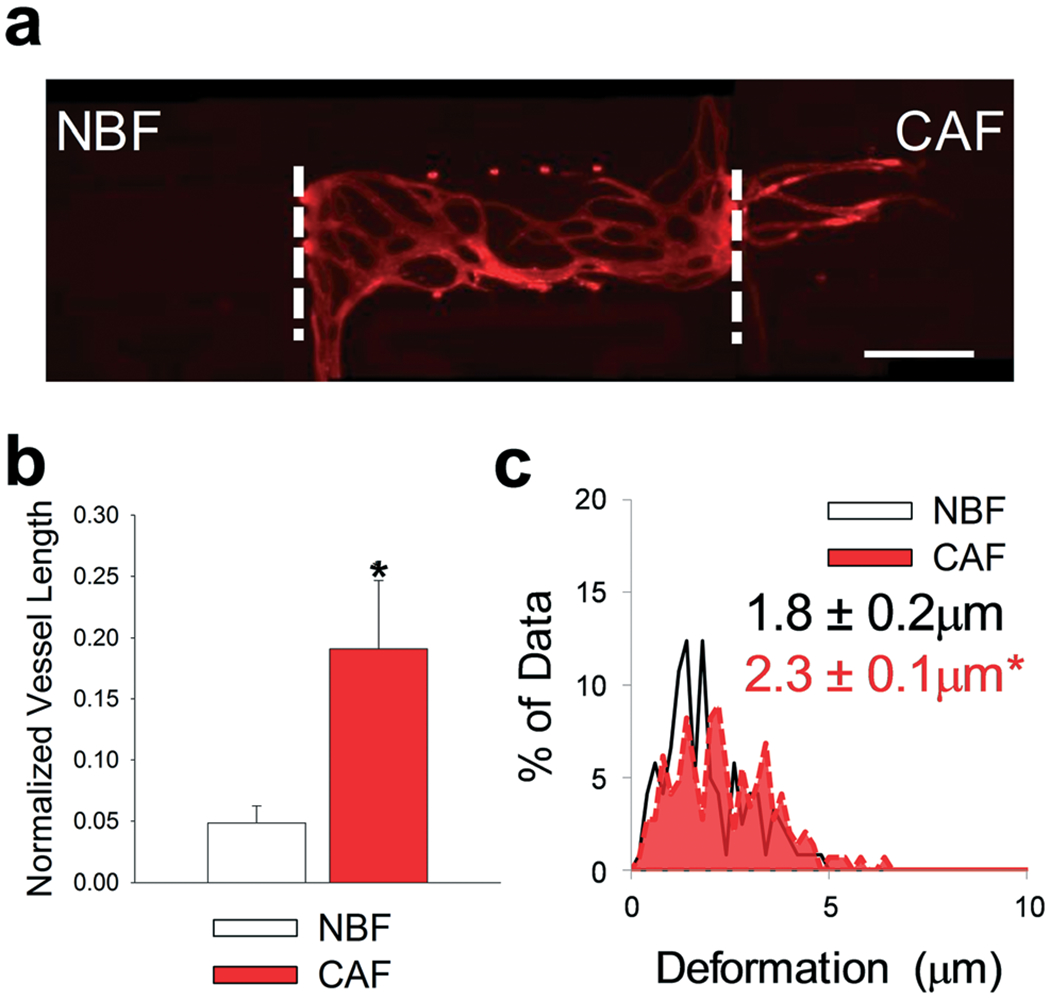
Fig. 4.

CAFs promoted angiogenesis in microtissue models. (a) Representative fluorescent image of multi-tissue chamber device loaded with NBFs in the left chamber, ECs and NHLF in the center chamber, and CAFs in the right chamber. Devices have been stained for CD31 after 8 days. White dashed lines represent interfaces between chambers. Scale bar = 500 μm. (b) Quantification of vessel growth in side chambers with different fibroblast populations, normalized to total vessel growth in center chamber. *p < 0.01 versus NBF chambers. n = four devices. (c) Histograms showing bead displacement tracked in the communication ports at the chamber interfaces. Inset numbers represent average bead deformation ± SEM. *p < 0.01 versus NBF. n = six devices. See Fig. S9a† for box plots and 95% CI for bead deformation data.
