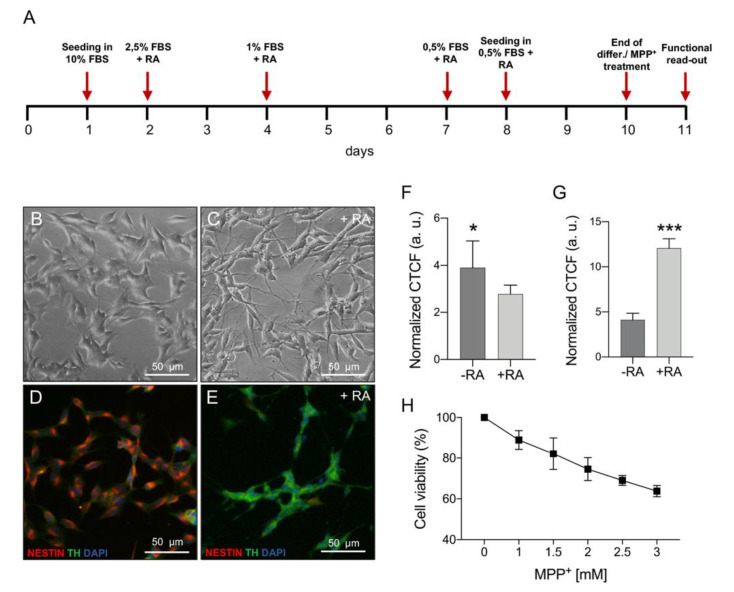
Figure 1.
Phenotypic characterization of undifferentiated vs. differentiated SH-SY5Y cells and MPP+ dose–response curve. (A) Timeline of the differentiation protocol. (B,C) Brightfield images showing morphological differences between undifferentiated cells on day zero (B) and differentiated cells at day nine (C); RA, retinoic acid. (D,E) Immunofluorescence images showing the different expression of nestin (red) and TH (green) in undifferentiated (D) and differentiated (E) cells. (F,G) Relative quantification of nestin (F) and TH (G) in undifferentiated and differentiated cells. (H) Dose–response curve for selected MPP+ concentrations on differentiated SH-SY5Y cells. * p < 0.05 and *** p < 0.001.

