Fig. 5.

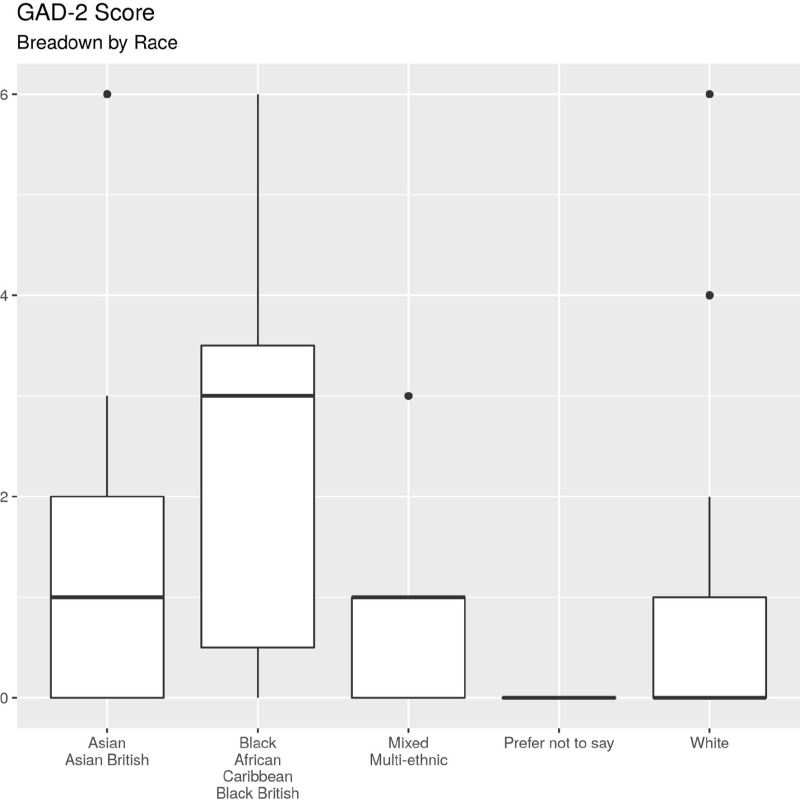
Boxplots of GAD-2 by race. Compared to other races those that identified as 'Black/African/Caribbean/Black British' had higher GAD-2 scores (p = 0.001575)

Boxplots of GAD-2 by race. Compared to other races those that identified as 'Black/African/Caribbean/Black British' had higher GAD-2 scores (p = 0.001575)