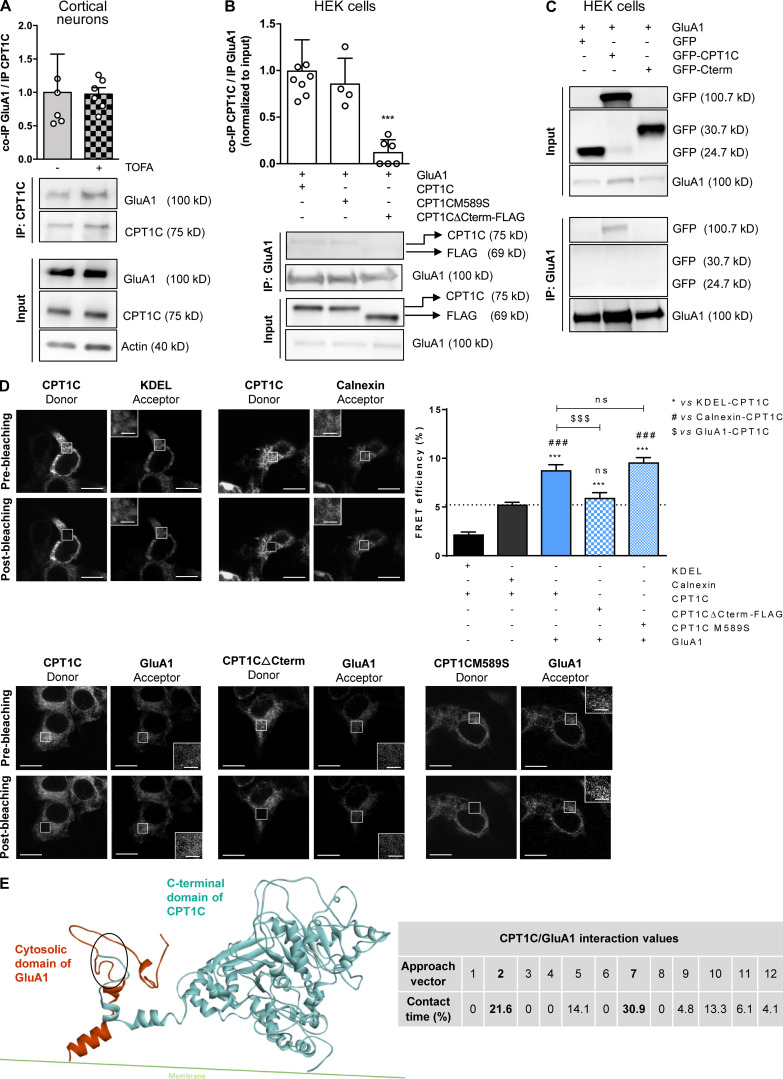
Figure 2.
CPT1C–GluA1 interaction is dependent on CPT1C C-terminal domain but not on malonyl-CoA levels. (A) Quantification of coimmunoprecipitated GluA1 after CPT1C immunoprecipitation in TOFA-treated cortical neurons. Results are the mean ± SD from three independent experiments performed by biological duplicates (n = 5 or 6 samples per condition; Mann-Whitney U test; P = 0.6991; 1.00 ± 0.57 for vehicle and 0.97 ± 0.24 for TOFA). (B) Coimmunoprecipitated CPT1C quantification versus immunoprecipitated GluA1 in HEK cells cotransfected with GluA1 and WT CPT1C, CPT1CM589S (a mutated form insensitive to malonyl-CoA), or CPT1CΔCterm-FLAG (a truncated form in which the last 39 aa have been substituted by the tag FLAG). Whole lysates (input) were used to corroborate a proper transfection. Western blots using antibodies against CPT1C, FLAG tag, and GluA1 were performed. Values are the mean ± SD from three independent experiments performed by biological replicates (one-way ANOVA followed by Bonferroni’s comparison test; ***, P < 0.001). GluA1 + WT CPT1C (1.00 ± 0.34, n = 8), GluA1 + CPT1CM589S (0.85 ± 0.28, n = 4), and GluA1 + CPT1CΔCterm-FLAG (0.12 ± 0.14, n = 6). (C) Coimmunoprecipitated GFP, CPT1C-GFP, or GFP-Cterm (GFP fused with the last 36 aa of CPT1C) in GluA1 immunoprecipitated samples from transfected HEK cells. Representative Western blots from four independent experiments are shown. (D) Percentage of FRET effciency between CFP-GluA1 and different YFP-CPT1C forms in transfected HEK cells (blue bars). KDEL (a short sequence with ER localization)/CPT1C and calnexin (an ER resident protein)/CPT1C pairs were used as negative controls for CPT1C interaction (black bars). GluA1/WT CPT1C pair was used as a positive control (solid blue). The dashed line represents the higher percentage of FRET of the negative control pairs. Results are the mean ± SEM from three independent experiments performed by biological duplicates (one-way ANOVA followed by Bonferroni’s comparison test; ***, P < 0.001 versus KDEL/CPT1C pair; ###, P < 0.001 versus calnexin/CPT1C pair; $$$, P < 0.001 versus GluA1/CPT1C pair). KDEL + CPT1C (2.13 ± 0.31, n = 36), calnexin + CPT1C (5.18 ± 0.30, n = 36), GluA1 + CPT1C (8.70 ± 0.65, n = 30), GluA1 + CPT1CΔCterm-FLAG (5.87 ± 0.59, n = 30), and GluA1 + CPT1CM589S (9.51 ± 0.56, n = 26). Scale bars = 10 µm; scale bars of inset magnifications = 2 µm. ns, not significant. (E) C-terminal CPT1C region encompassing the catalytic globular domain and the cytosolic GluA1 domain was used for protein–protein interaction simulations. The percentage of contact time for each of the 12 approaching vectors analyzed is shown in the table. The two approaching vectors with the highest contact time are shown in bold. A ribbon representation of the GluA1 (orange) and CPT1C (blue) interaction frame from approach vector 7 is shown. The main contact region is highlighted by the oval and corresponds to residues 843–851 for GluA1 and 786–792 for CPT1C (localized in the C-terminal domain, which ends in residue 803).

