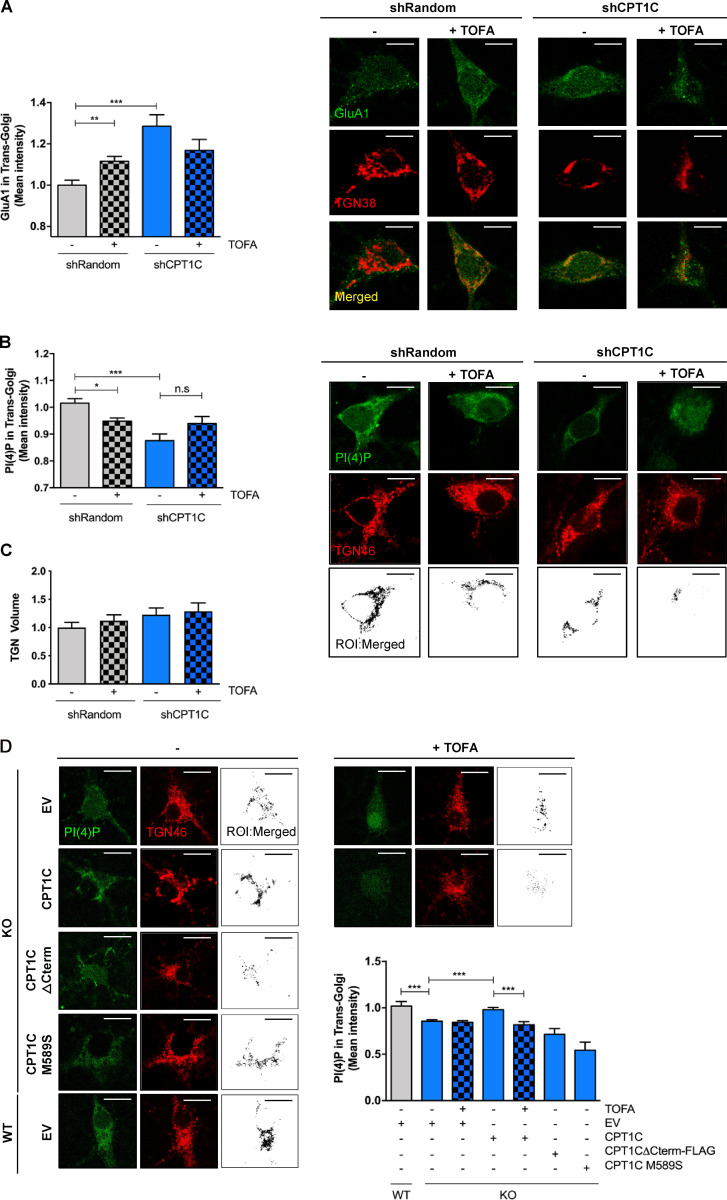
Figure 4.
CPT1C regulates GluA1 and PI(4)P levels at the TGN in a malonyl-CoA–dependent manner. (A) GluA1 retention at the TGN. CPT1C was silenced in WT cortical neurons by the transduction of shCPT1C-carrying lentivirus. A short hairpin-loop RNA with a random sequence (shRandom) was used as a control. At 14–15 DIV, cells were treated with TOFA (20 µg/ml, 2 h), fixed, and permeabilized in order to analyze the levels of GluA1 in the TGN by coimmunocytochemistry. TGN38 protein was used to localize and define the TGN compartment. The mean intensity of GluA1 in the TGN compartment per each neuron soma was analyzed. Graph shows the mean ± SEM of 20 cells from two independent experiments performed by biological duplicates (two-way ANOVA followed by Bonferroni’s comparison test; **, P < 0.01 and ***, P < 0.001). shRandom + vehicle (1.00 ± 0.02, n = 19), shRandom + TOFA (1.12 ± 0.03, n = 27), shCPT1C + vehicle (1.29 ± 0.06, n = 23), and shCPT1C + TOFA (1.17 ± 0.06, n = 21). Scale bars = 7 µm. (B) Quantification of PI(4)P levels in the TGN compartment by immunocytochemistry in control or CPT1C-silenced neurons after TOFA treatment (20 µg/ml, 2 h). PI(4)P was detected by immunocytochemistry using a specific antibody purchased from Echelon (Z-P004). TGN46 protein was used to localize and define the TGN compartment. Below, black-and-white images show the ROI generated by TGN-PI(4)P colocalizing pixels. The mean intensity of PI(4)P in the TGN compartment per each neuron soma was analyzed. Data represent the mean ± SEM from four independent experiments performed by biological duplicates (two-way ANOVA followed by Bonferroni’s comparison test; *, P < 0.05 and ***, P < 0.001). shRandom + vehicle (1.00 ± 0.02, n = 42), shRandom + TOFA (0.95 ± 0.01, n = 48), shCPT1C + vehicle (0.88 ± 0.03, n = 39), and shCPT1C + TOFA (0.94 ± 0.04, n = 37). Scale bars = 7 µm. n.s, not significant. (C) Quantification of the TGN volume per each neuron soma in the same experiments and conditions as in B. Values are the mean ± SEM from two independent experiments performed by biological replicates (two-way ANOVA; P > 0.05). shRandom + vehicle (1.00 ± 0.09, n = 22), shRandom + TOFA (1.12 ± 0.10, n = 23), shCPT1C + vehicle (1.23 ± 0.11, n = 19), and shCPT1C + TOFA (1.29 ± 0.13, n = 18). (D) Quantification of PI(4)P levels in the TGN compartment in CPT1C KO cortical neurons overexpressing or not CPT1C full or different mutated CPT1C forms and submitted to TOFA treatment (20 µg/ml, 2 h). Analysis was performed as in Fig. 4 B. On the right, black-and-white images show the ROI generated by TGN-PI(4)P colocalizing voxels. Results are shown as the mean ± SEM from two independent experiments performed by biological duplicates (one-way ANOVA followed by Bonferroni’s comparison test; ***, P < 0.001). WT + EV + vehicle (1.00 ± 0.05, n = 7), KO + EV + vehicle (0.86 ± 0.01, n = 43), KO + EV + TOFA (0.84 ± 0.02, n = 40), KO + CPT1C + vehicle (0.98 ± 0.02, n = 36), KO + CPT1C + TOFA (0.81 ± 0.03, n = 46), KO + CPT1CΔCterm-FLAG + vehicle (0.71 ± 0.06, n = 26), and KO + CPT1CM589S + vehicle (0.54 ± 0.08, n = 25). Scale bars = 7 µm.

