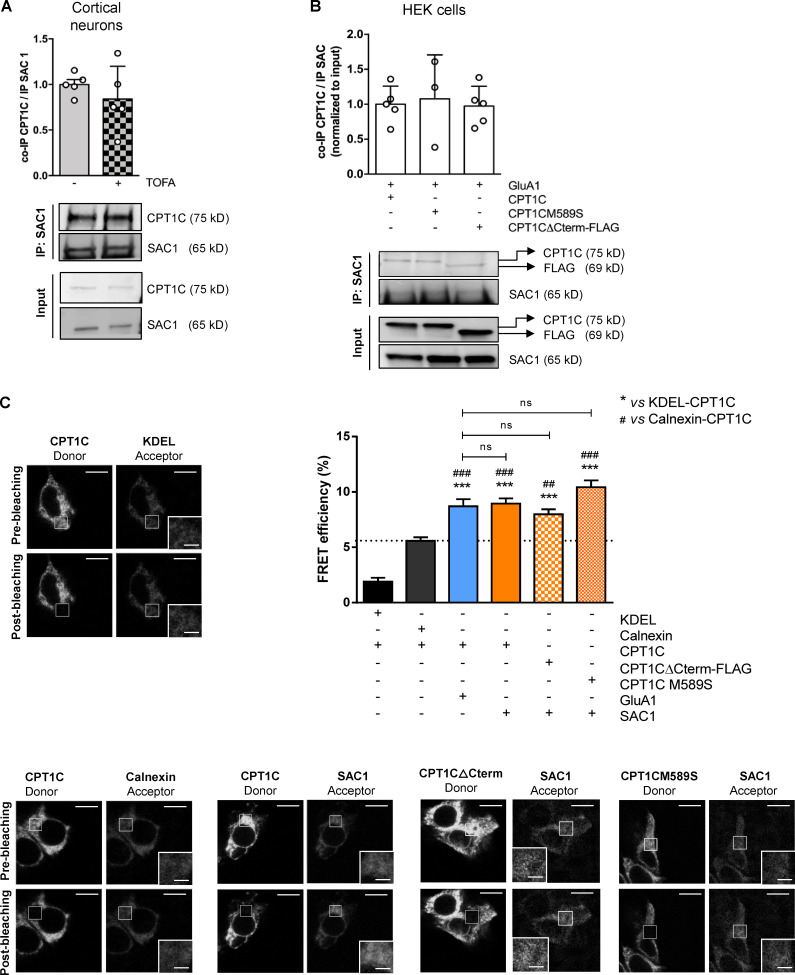
Figure 5.
CPT1C–SAC1 interaction is dependent on neither malonyl-CoA levels nor CPT1C C-terminal domain. (A) Quantification of coimmunoprecipitated CPT1C after SAC1 immunoprecipitation in TOFA-treated cortical neurons. Results are the mean ± SD from two independent experiments performed by biological replicates (n = 5 samples per condition; Mann-Whitney U test; P = 0.4206; 1.00 ± 0.12 for vehicle and 0.84 ± 0.36 for TOFA). (B) Quantification of coimmunoprecipitated CPT1C by SAC1 immunoprecipitation in cotransfected HEK cells. Western blot using antibodies against CPT1C, FLAG tag, and SAC1 was performed. Values are the mean ± SD from three independent experiments (one-way ANOVA followed by Bonferroni’s comparison test; P > 0.05; SAC1 + WT CPT1C 1.00 ± 0.26, n = 5; SAC1 + CPT1CM589S 1.08 ± 0.63, n = 3; and SAC1 + CPT1CΔCterm-FLAG 0.97 ± 0.28, n = 5). (C) Percentage of FRET efficiency between SAC1 and different CPT1C mutated forms in transiently transfected HEK293 cells (orange bars). KDEL/CPT1C and calnexin/CPT1C pairs were used as negative controls for CPT1C interaction (black bars). The GluA1/WT CPT1C pair was used as a positive control (blue bar). The dashed line indicates the highest percentage of FRET corresponding to a negative interaction. Results are the mean ± SEM from three independent experiments performed by biological replicates (n = 30 cells per condition; one-way ANOVA followed by Bonferroni’s comparison test; ***, P < 0.001 versus KDEL/CPT1C pair; ##, P < 0.01, and ###, P < 0.001 versus calnexin/CPT1C pair). KDEL + CPT1C (1.91 ± 0.33, n = 27), calnexin + CPT1C (5.58 ± 0.32, n = 31), GluA1 + CPT1C (8.70 ± 0.65, n = 30), SAC1 + CPT1C (8.94 ± 0.48, n = 31), SAC1 + CPT1CΔCterm-FLAG (7.98 ± 0.45, n = 36), and SAC1 + CPT1CM589S (10.42 ± 0.62, n = 31). Scale bars = 10 µm; scale bars of inset magnifications = 2 µm. ns, not significant.

