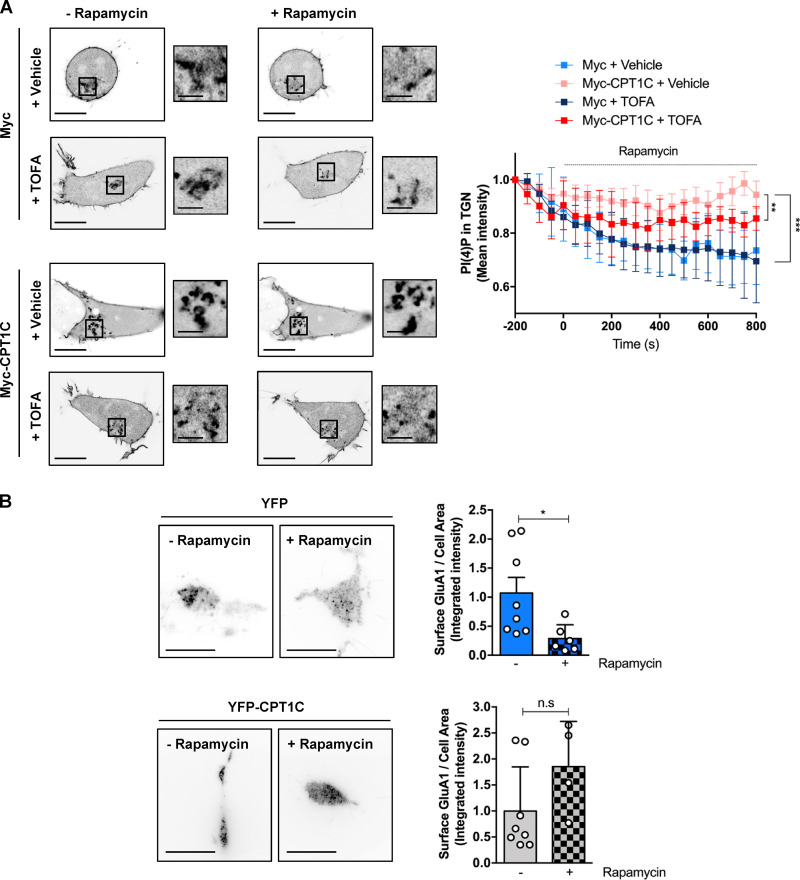
Figure 8.
Artificially formed ER-TGN contacts decrease surface GluA1 levels. (A) PI(4)P at the TGN after artificial ER-TGN contact creation. HEK cells overexpressing or not Myc-CPT1C were transfected with the mCherry-pHR-TcRb-FKBP and CFP-TGN38-FRB plasmids and treated with rapamycin (5 µM, 30 min) in order to induce ER-TGN contacts. PI(4)P was labeled with the lipid probe YFP-P4M. A Myc EV was used as a control. Cells were treated with TOFA 24 h after transfection. Cells were live imaged with confocal microscopy. Values are the mean ± SD from four independent experiments (n = 6 cells per condition; two-way ANOVA followed by Bonferroni’s comparison test; **, P < 0.01 and ***, P < 0.001). (B) Surface GluA1 levels after artificial ER-TGN contact creation. Live HEK cells were transfected and treated as in A. Surface GluA1 was imaged by TIRF microscopy. Data represent the mean ± SD from two independent experiments (n = 4–8 cells per condition; two-sided Student’s t test; *, P < 0.05 in YFP control cells and P = 0.0503 in YFP-CPT1C overexpressing cells). EV + vehicle (1.00 ± 0.76, n = 8), EV + rapamycin (0.29 ± 0.10, n = 6), CPT1C + vehicle (1.00 ± 0.85, n = 8), and CPT1C + rapamycin (1.85 ± 0.87, n = 4). Scale bars = 7 µm; scale bars of inset magnifications = 1.75 µm. n.s, not significant.

