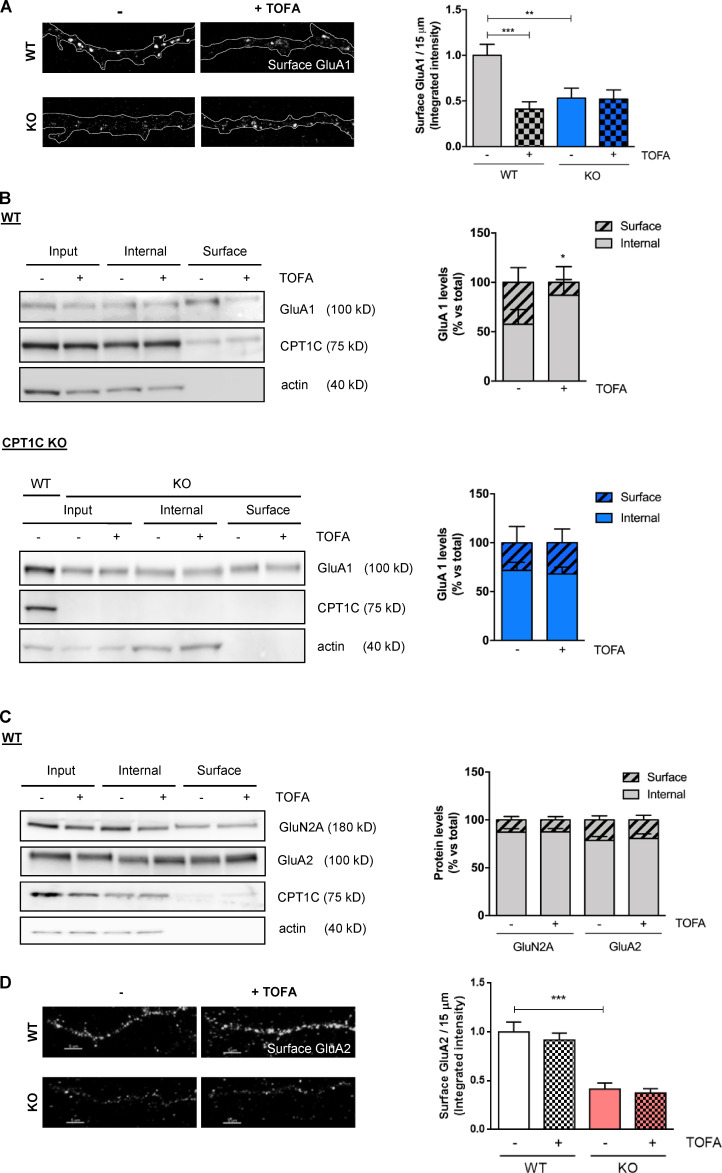
Figure S3.
TOFA treatment decreases the levels of GluA1 but not GluA2 and GluN2A at the surface of cortical neurons in a CPT1C-dependent manner. (A) Surface GluA1 quantification by immunochemistry in nonpermeabilized WT and CPT1C KO cortical neurons treated with TOFA. Values are the mean ± SEM of two independent experiments (two-way ANOVA followed by Bonferroni’s comparison test; **, P < 0.01 and ***, P < 0.001). WT + vehicle (1.00 ± 0.12, n = 67), WT + TOFA (0.41 ± 0.08, n = 45), KO + vehicle (0.53 ± 0.11, n = 36), and KO + TOFA (0.52 ± 0.10, n = 38). (B) Surface GluA1 levels measured by the biotinylation assay in WT and CPT1C KO cortical neurons. Results are given as the mean ± SD from three independent experiments performed by biological replicates (n = 4 samples per condition; two-way ANOVA followed by Bonferroni’s comparison test; *, P < 0.05 for surface levels). WT + vehicle (57.54 ± 7.47 for surface and 42.46 ± 7.47 for internal, n = 4), WT + TOFA (13.05 ± 7.96 for surface and 86.95 ± 7.96 for internal, n = 4), KO + vehicle (28.31 ± 16.55 for surface and 71.69 ± 16.55 for internal, n = 4), and KO + TOFA (31.95 ± 14.05 for surface and 68.07 ± 14.05 for internal, n = 4). (C) Surface GluN2A and GluA2 quantification by biotinylation in cortical neurons. Results are mean ± SD from two independent experiments performed by biological replicates (two-way ANOVA followed by Bonferroni’s comparison test; P > 0.05). GluN2A vehicle (12.78 ± 7.17 for surface and 87.22 ± 7.17 for internal, n = 4), GluN2A TOFA (12.55 ± 6.87 for surface and 87.45 ± 6.87 for internal, n = 4), GluA2 vehicle (22.59 ± 10.24 for surface and 77.40 ± 10.24 for internal, n = 5), and GluA2 TOFA (19.22 ± 12.43 for surface and 80.78 ± 12.43 for internal, n = 5). (D) Surface GluA2 quantification by immunocytochemistry in WT and CPT1C KO cortical neurons. Results are mean ± SEM of one experiment performed by biological duplicates (two-way ANOVA followed by Bonferroni’s comparison test; ***, P < 0.001). WT + vehicle (1.00 ± 0.10, n = 37), WT + TOFA (0.92 ± 0.07, n = 34), KO + vehicle (0.41 ± 0.06, n = 32), and KO + TOFA (0.37 ± 0.04, n = 24). Scale bars = 5 µm.

