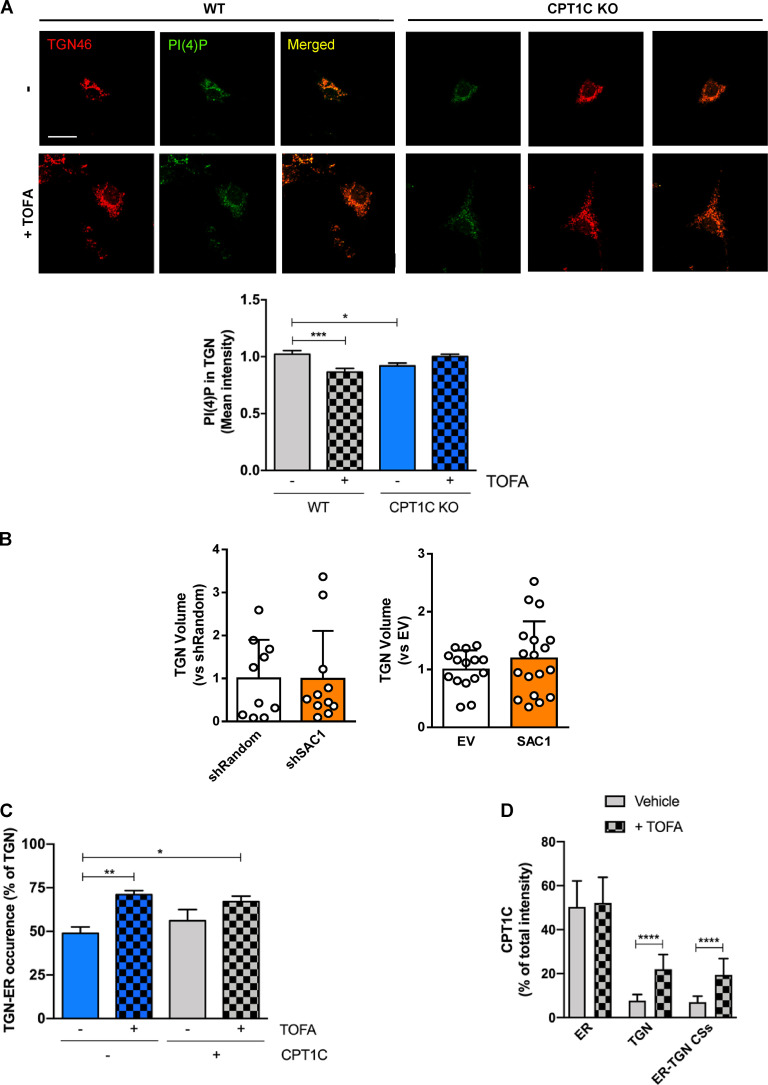
Figure S4.
Effects of TOFA treatment or SAC1 modulation on PI(4)P levels, TGN volume, and TGN-ER occurrence. (A) Quantification of PI(4)P levels using the specific plasmid mCherry-P4M at the TGN compartment (TGN46) in WT or CPT1C KO neurons after TOFA treatment (20 µg/ml, 2 h). Data represent the mean ± SEM from two independent experiments performed by biological duplicates (two-way ANOVA followed by Bonferroni’s comparison test; *, P < 0.05 and ***, P < 0.001). WT + vehicle (1.00 ± 0.03, n = 26), WT + TOFA (0.87 ± 0.03, n = 26), KO + vehicle (0.92 ± 0.02, n = 20), and KO + TOFA (1.00 ± 0.02, n = 28). Scale bar = 7 µm. (B) SAC1 modulation (overexpressing, OE, or knocking down, KD) does not change TGN volume. The same images used in Fig. 6, B and E were taken to analyze TGN volume in KD or OE SAC1 neurons. Values are the mean ± SD from two independent experiments (Mann-Whitney U test and P = 0.8444 for KD experiment; two-sided Student’s t test and P = 0.3062 for OE experiment). For KD experiment, short hairpin-loop RNA with a random sequence (shRandom; 1.00 ± 0.90, n = 10) and shSAC1 (0.99 ± 1.11, n = 11). For OE experiment, EV (1.00 ± 0.33, n = 15) and SAC1 (1.20 ± 0.64, n = 18). (C) TGN-ER occurrence increases upon TOFA treatment. The same images used in Fig. 7, B–D were taken to analyze the percentage of TGN that was forming contacts with the ER. Results are the ratio between the TGN-ER contact area and the TGN area per cell, given as a percentage. Data represent the mean ± SD of two independent experiments performed by biological duplicates (two-way ANOVA followed by Bonferroni’s comparison test; *, P < 0.05 and **, P < 0.01). EV + vehicle (0.49 ± 0.13, n = 13), EV + TOFA (0.71 ± 0.08, n = 13), CPT1C + vehicle (0.56 ± 0.23, n = 13), and CPT1C + TOFA (0.67 ± 0.11, n = 13). (D) CPT1C intensity at ER-TGN contact sites. The images used in Fig. 7 E were also used for analyzing CPT1C intensity inside the ROIs of the ER, TGN, and ER-TGN contacts (CSs) relative to the total CPT1C intensity in the whole cell (expressed in percentage). The graph represents the mean ± SD from two independent experiments performed by biological duplicates (two-way ANOVA followed by Bonferroni’s comparison test; ****, P < 0.001). ER vehicle (50.37 ± 11.83, n = 13), ER TOFA (52.22 ± 11.69, n = 15), TGN vehicle (7.74 ± 2.73, n = 13), TGN TOFA (21.99 ± 7.02, n = 15), ER-TGN vehicle (7.04 ± 2.72, n = 13), and ER-TGN TOFA (19.43 ± 7.66, n = 15).

