Figure S1.
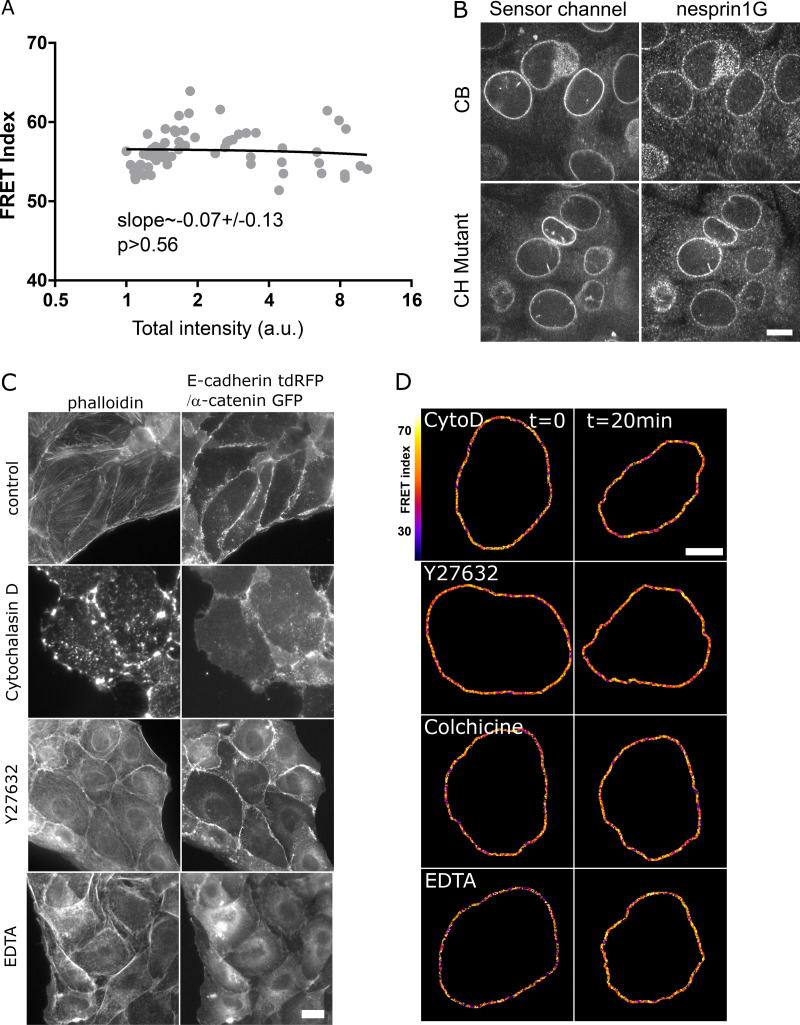
Validation of CB and CH mutant constructs, with drug treatments. (A) FRET index of the CB construct as a function of its transient expression level in MDCK cells (n = 64; total intensity is the emission intensity sum between 476 and 557 nm encompassing both donor and acceptor emissions); one replicate. Solid line is a linear fit (least-squares linear regression); P value was derived from an extra sum-of-squares F test with slope = 0 as null hypothesis. (B) Nuclear envelope localization of nesprin-1G by immunofluorescence in cells expressing either the CB or the CH mutant construct. Scale bar = 10 µm. (C) Effects of pharmacological treatments on the cytoskeleton. E-cadherin-tandem dimer RFP (two first rows) or α-catenin-GFP cells (other rows, to visualize intercellular contacts) treated as in Fig. 1 D. Control cells exhibit F-actin at contacts and at the ventral surface. Cytochalasin D resulted in dense actin aggregates, Y27632 in an altered cytoplasmic organization with some nuclear envelope recruitment at the expense of ventral stress fibers, and EDTA in a loss of intercellular contacts and subsequent recruitment. Scale bar = 10 µm. (D) FRET index map of the CH construct in MDCK cells before and after pharmacological perturbations. Cyto D, cytochalasin D. Compare with Fig. 1 D. Scale bar = 5 µm.

