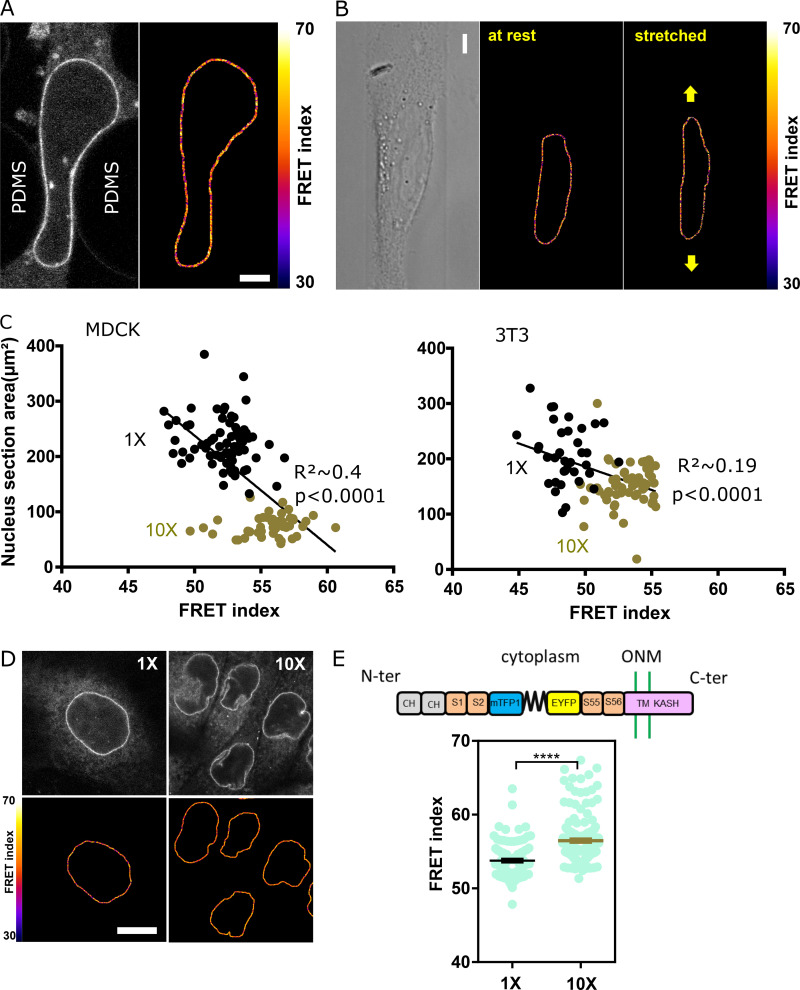
Figure S2.
Effects of mechanical perturbations on the CH mutant and nesprin with sensor between SR2 and 55 constructs. (A) Direct fluorescence image and FRET index map of an MDCK cell expressing the CH construct within a constriction. Compare with Fig. 2 A. Scale bar = 5 µm. (B) Direct fluorescence image and FRET index map of an MDCK cell expressing the CH construct plated on a collagen stripe on the stretchable substrate. Compare with Fig. 2 C. Scale bar = 5 µm. (C) Nucleus section area as a function of FRET index for low (1×) and high (10×) cell densities for MDCK (top; n = 73 1×, 45 10×) and NIH 3T3 (right; n = 36 1×, 59 10×) cells; two replicates. Solid lines are linear fits (R2 was derived from a least-squares linear regression; P value was derived from an extra sum-of-squares F test with slope = 0 as null hypothesis). (D) MDCK cells expressing the CH construct plated at 5 × 10² cells/mm2 (1×) and 5 × 10³ cells/mm2 (10×). Top: Fluorescence, bottom: FRET index map. Compare with Fig. 2 E. Scale bar = 10 µm. (E) Top: Schematic illustration of the nesprin construct with the tension sensor inserted between spectrin repeats 2 and 55. ONM, outer nuclear membrane; S1…S56, spectrin repeat number; TM, trans-membrane domain. Bottom: FRET index of the construct illustrated above at 1× and 10× densities in MDCK cells (n = 93 1×, 184 10×). Compare with Fig. 2 F. Mean ± SEM. Two-tailed Mann-Whitney test. ****, P < 0.0001.

