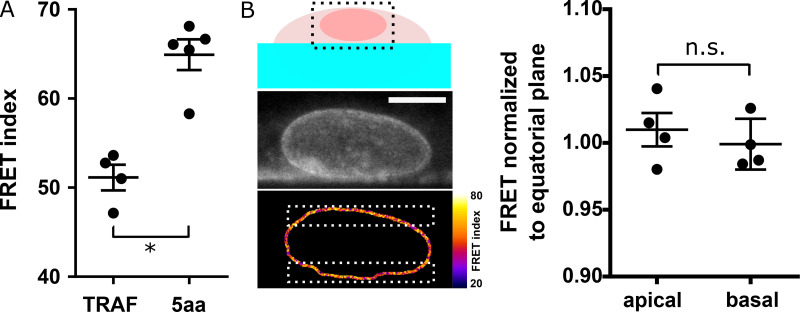
Figure S5.
FRET calibration and tension dependence on z. (A) FRET index of 5aa and TRAF standards expressed in MDCK cells (n = 4); one replicate. (B) Left: Sketch of a cell growing on the side of a PDMS channel for FRET analysis along z. Direct fluorescence and FRET index of an MDCK cell stably expressing the CB construct from the region in the dotted box above. Right: Normalized FRET index from the white dotted boxes on the left (n = 4); one replicate. Scale bar = 5 µm. Mean ± SEM. Two-tailed Kruskal-Wallis test. *, P < 0.05.

