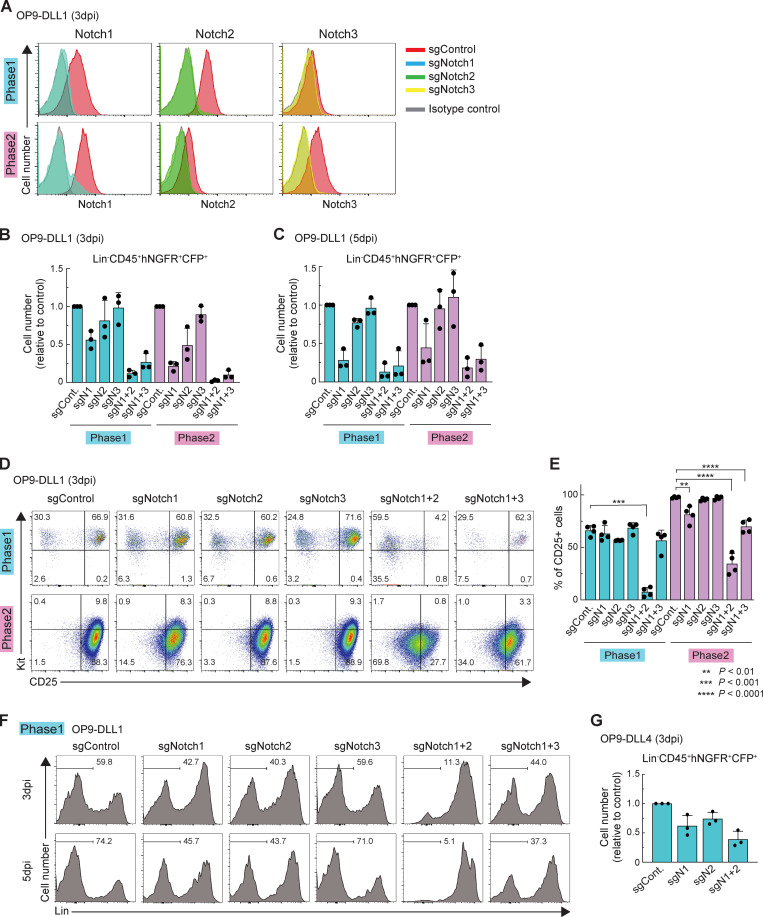
Figure S1.
Acute deletion of Notch accelerates generation of Lin+ cells. (A) Flow cytometric analysis of phase 1 (upper) and phase 2 (lower) pro-T cells was performed at 3 dpi. Representative Notch1, Notch2, and Notch3 profiles in Lin−CD45+CFP+ sgRNA-transduced cells are shown. Results are representative of two independent experiments. (B and C) Flow cytometric analysis of phase 1 and phase 2 DN cells was performed at 3 dpi (B) or 5 dpi (C). Relative cell numbers of Lin−CD45+CFP+hNGFR+ sgRNA-transduced cells against sgControl-transduced cells are shown with SD. Data are based on three independent experiments. (D) Flow cytometric analysis of phase 1 (upper) and phase 2 (lower) DN cells was performed at 3 dpi. Representative c-Kit/CD25 profiles in Lin−CD45+CFP+hNGFR+ sgRNA-transduced cells are shown. Results are representative of four independent experiments. (E) The percentages of CD25+ cells among Lin−CD45+CFP+hNGFR+ sgRNA-transduced phase 1 and phase 2 cells at 3 dpi (D) are indicated with SD. **, P < 0.01; ***, P < 0.001; ****, P < 0.0001 by one-way ANOVA followed by Dunnett’s test. Data are based on four independent experiments. (F) Flow cytometric analysis of phase 1 pro-T cells (Fig. 1 C) was performed at 5 dpi. Representative Lin profiles in CD45+CFP+hNGFR+ sgRNA-transduced cells are shown. Numbers indicate percentages of Lin– cells. Results are representative of four independent experiments. (G) Flow cytometric analysis of phase 1 pro-T cells, cocultured on OP9-DLL4, was performed at 3 dpi. Relative cell numbers of Lin−CD45+CFP+hNGFR+ sgRNA-transduced cells against sgControl-transduced cells are shown with SD. Data are based on three independent experiments.

