Figure 4.
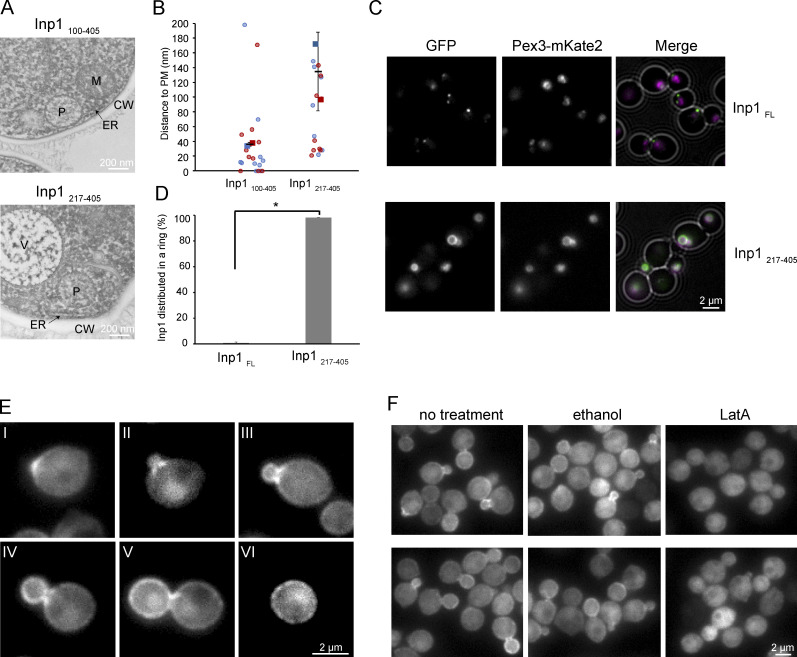
The N-terminal half of Inp1 is important for cortical association. (A) Electron micrographs of cryofixed glucose-grown cells of the indicated strains. P, peroxisome; V, vacuole; M, mitochondrion; CW, cell wall. (B) Quantification of the distance between the peroxisomal membrane and the PM in 2 × 10 peroxisomes from two independent experiments. The data are plotted in a SuperPlot, and the duplicate experiments are color coded. The circles represent the single data points. Error bars represent SD. (C) Single focal plane FM images of cells producing GFP tagged FL Inp1 or the indicated Inp1 truncation. Cells were grown for 8 h on methanol. (D) Quantification of the percentage of peroxisomes in which Inp1-GFP is distributed equally over the surface of the peroxisomes. 2 × 150 peroxisomes from two independent experiments were quantified. Error bars indicate the SD. Two-tailed Student’s t test was performed. *, P < 0.05. (E) Single focal plane FM images of glucose-grown pex3 cells producing Inp1-GFP under the control of the PTEF1. Different stages of budding are shown. At the onset of budding, Inp1-GFP accumulates at the site of bud emergence (I). Next, fluorescence accumulates in patches close to the bud neck (II–IV). At a later stage, the highest fluorescence signal was observed at the cortex of the buds (IV and V), while after separation of the bud, patches of enhanced fluorescence were detected over the entire cell cortex (VI). (F) Single focal plane FM images of the same cells as in E treated for 15 min with ethanol or LatA, respectively. Untreated cells were used as a control.

