Figure 4.
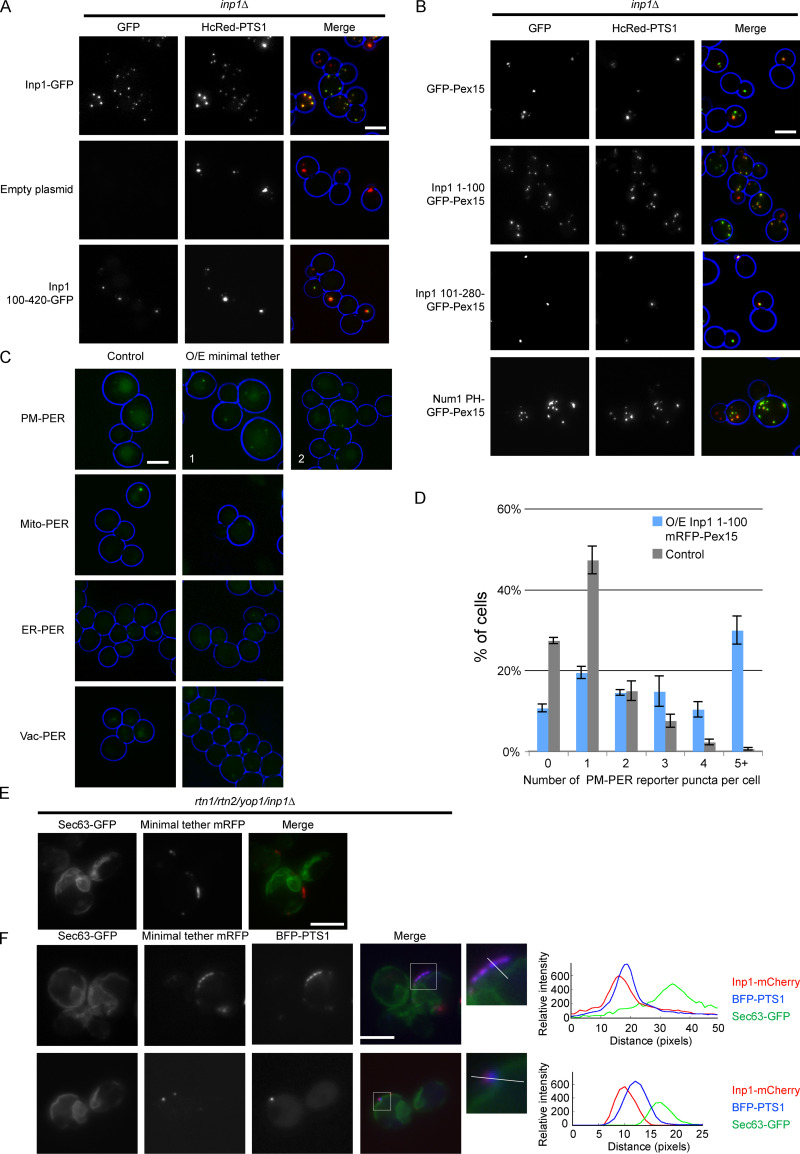
Inp1 has the structural and functional capacity to be a PM-PER tether. (A) The Inp1-GFP truncation 100–420 was expressed under control of the INP1 promoter in inp1Δ cells with the constitutively expressed HcRed-PTS1. Cells were examined by epifluorescence microscopy. (B) Truncations of Inp1 or the PH domain of Num1 (amino acids 2,563–2,692) fused to GFP-Pex15 were expressed under control of the INP1 promoter in inp1Δ cells with the constitutively expressed HcRed-PTS1 and examined by epifluorescence microscopy. (C) The Inp1 1–100 truncation was fused to mRFP-Pex15, and this minimal tether was overexpressed under the control of the TPI1 promoter in different peroxisome contact site split reporters. ER-PER, ER–peroxisome; Mito-PER, mitochondria–peroxisome; Vac-PER, vacuole–peroxisome. Cells were examined by epifluorescence microscopy for the presence of GFP puncta indicative of interorganelle contact sites. Images labeled 1 and 2 indicate various examples of the effect that overexpression of the minimal tether had on the PM-PER split reporter. Whole-cell projections are shown. (D) Quantification of the effect of overexpression of the minimal tether Inp1 1–100 mRFP-Pex15 on PM-PER split reporter. Over 100 cells were analyzed for each strain. Three independent experiments were performed. Error bars represent SEM. (E) Inp1 1–100-mRFP-Pex15 was overexpressed under the control of the TPI1 promoter in rtn1/rtn2/yop1/inp1Δ cells with Sec63-GFP and analyzed using epifluorescence microscopy. (F) Inp1 1–100-mRFP-Pex15 was overexpressed under the control of the TPI1 promoter in rtn1/rtn2/yop1/inp1Δ cells with Sec63-GFP and BFP-PTS1 and analyzed using epifluorescence microscopy. The boxed areas are magnified. The graphs show relative fluorescence intensities of Inp1 (red), the peroxisomal matrix (blue), and the ER (green) along a line drawn through the center of the Inp1 foci. In A–C, whole-cell projections are shown. In E and F, a single focal plane is shown. Scale bars, 5 µm.

