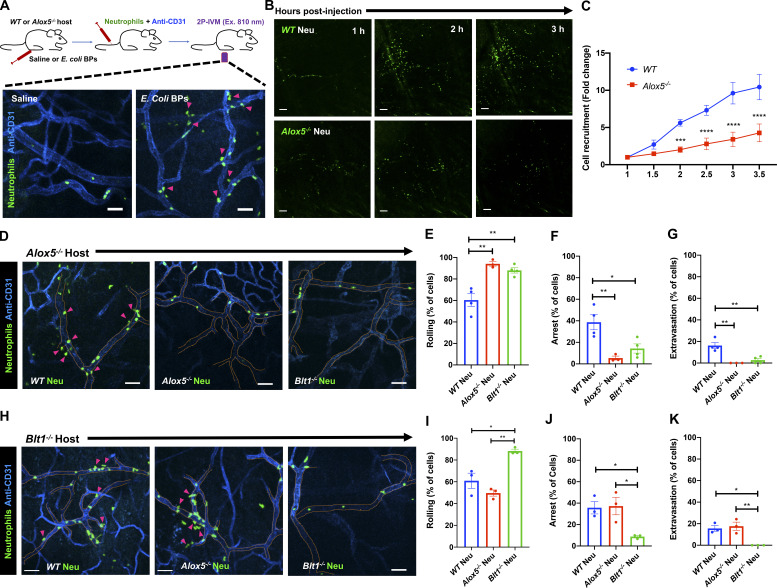
Figure 1.
Production and sensing of LTB4 via BLT1 in neutrophils promotes recruitment, arrest, and extravasation response in vivo. (A) Upper panel: Diagram of the 2P-IVM procedures in the footpad of an adoptive transfer mouse model. Lower panels: Neutrophils purified from WT mouse strains were labeled with CellTracker Green CMFDA and adoptively transferred to recipient WT mice that were injected in the footpad with either saline (left panel) or E. coli BPs (right panel) and imaged by 2P-IVM. Maximum projections of Z-stacks are shown (vasculature in blue and neutrophils in green). Pink arrowheads mark extravasating neutrophils (right panel). Scale bars = 50 µm. The experiments were performed in n = 2 mice. See Video 2. (B and C) Neutrophils purified from either WT (upper panels) or Alox5−/− (lower panels) mice were labeled with CellTracker Green CMFDA and adoptively transferred to Alox5−/− mice with inflamed footpads. Maximum projections of Z-stacks of the footpads are presented for 1 h, 2 h, and 3 h after injection (B). Scale bars = 100 µm. The number of neutrophils recruited to the footpad were scored and expressed as fold change with respect to the number of neutrophils at 1 h post-inflammation (C). Data are plotted as mean ± SEM with n = 3 mice per condition. Two-way ANOVA using Sidak’s multiple comparisons test was performed to determine statistical significance. (D–K) Neutrophils purified from WT or Alox5−/− or Blt1−/− mice were labeled with CellTracker Green CMFDA and adoptively transferred to Alox5−/− (D–G) or Blt1−/− (H–K) mice with inflamed footpads. 2P-IVM time-lapse images were acquired 1.5 h after E. coli BP injection (Videos 3 and 4). Still images represent maximum-intensity projections of Z-stacks in Alox5−/− (D) or Blt1−/− (H) mice. Dashed tangerine lines indicate vessel boundaries (blue), and magenta arrowheads point to extravasating neutrophils (green). Scale bars = 50 µm. Neutrophils were scored for rolling (E and I), arrest (F and J), and extravasation (G and K) response in Alox5−/− and Blt1−/− mice, respectively, as described in the Materials and methods section. Data are plotted as the percentage of neutrophils exhibiting a specific behavior and represented as mean ± SEM. Each dot represents the result from an individual animal. One-way ANOVA using Dunnett’s multiple comparisons test was performed to determine statistical significance. *, P < 0.05; **, P < 0.01; ***, P < 0.001; ****, P < 0.0001.

